Fig. 1
Download original image
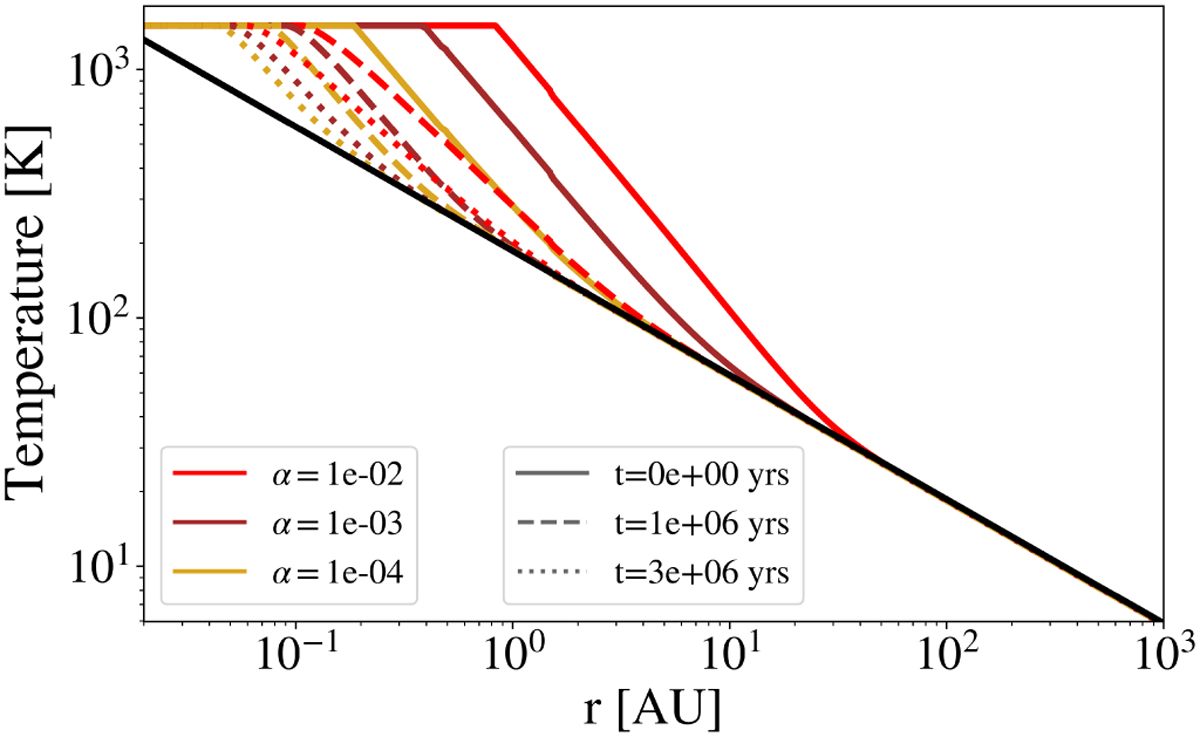
Temperature structure of the disk as a function of distance from the central star. The solid red, brown, and orange lines correspond to the initial temperature profiles using viscosities of 10−2, 10−3, and 10−4, respectively. The solid black line is a power-law temperature profile that remains static, chosen to match the outer disk temperature of a passively heated disk. The dashed and dotted lines show the evolution of the temperature at 0, 106, and 3 × 10⁶ years.
Current usage metrics show cumulative count of Article Views (full-text article views including HTML views, PDF and ePub downloads, according to the available data) and Abstracts Views on Vision4Press platform.
Data correspond to usage on the plateform after 2015. The current usage metrics is available 48-96 hours after online publication and is updated daily on week days.
Initial download of the metrics may take a while.