Fig. 9.
Download original image
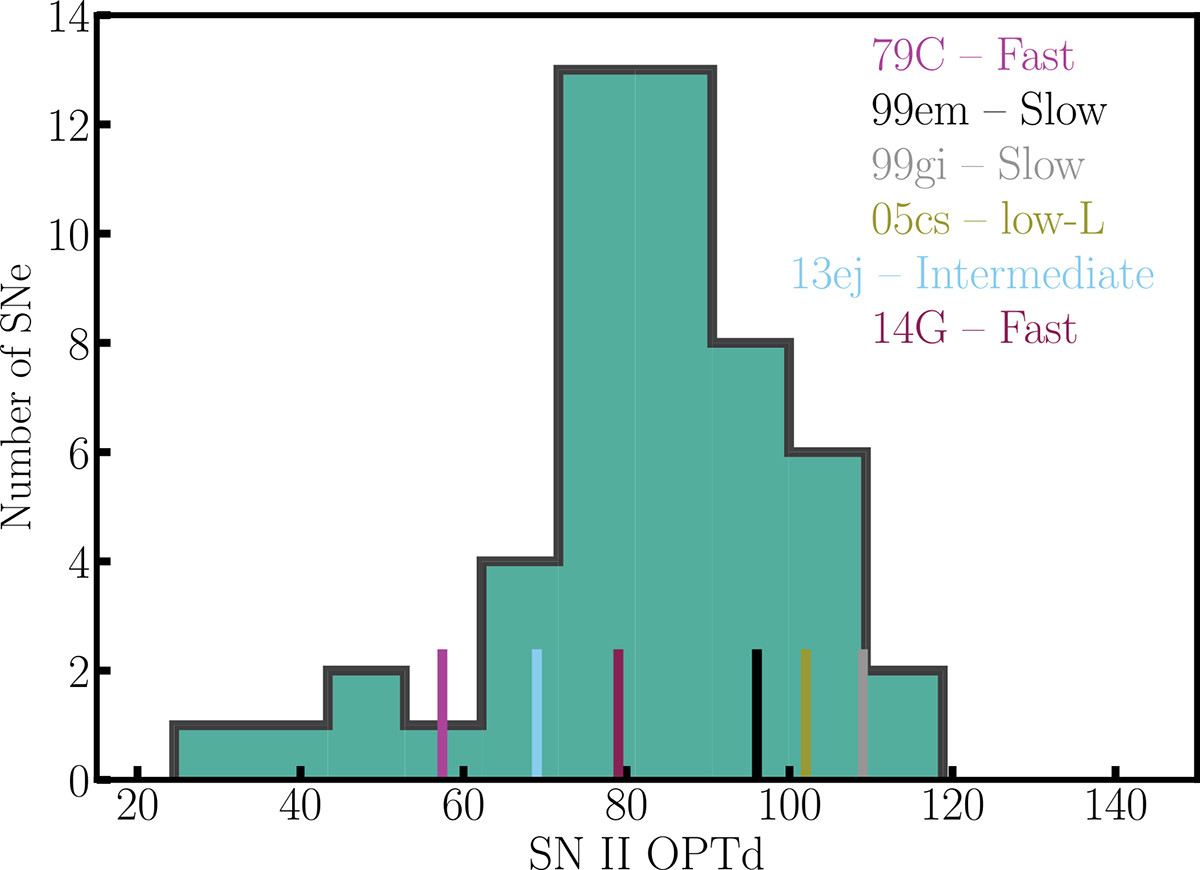
OPTd plateau duration distribution measured in the V band for the CSP and comparison samples. The comparison-sample values are shown as ticks on the abscissa. (ASASSN-15nx is not shown here as it was not possible to define the end of any plateau phase – there is no discernible break to the post maximum decline rate out to late times).
Current usage metrics show cumulative count of Article Views (full-text article views including HTML views, PDF and ePub downloads, according to the available data) and Abstracts Views on Vision4Press platform.
Data correspond to usage on the plateform after 2015. The current usage metrics is available 48-96 hours after online publication and is updated daily on week days.
Initial download of the metrics may take a while.