Open Access
Fig. 7.
Download original image
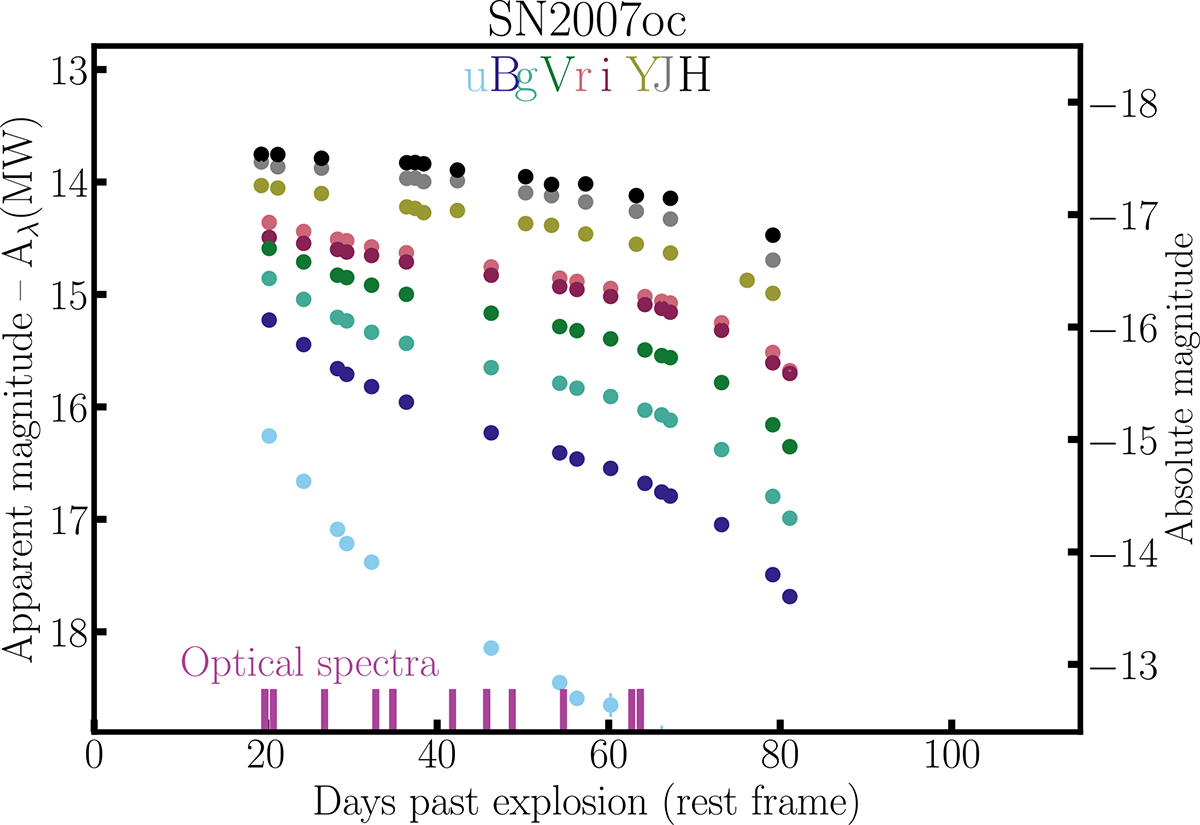
uBgVri and YJH apparent and absolute magnitude light curves of SN 2007oc plotted relative to the explosion epoch. Epochs when visual-wavelength spectra were obtained are indicated on the abscissa. (Such light curves for all SNe II in our sample can be found on Zenodo through the link in the data availability section.)
Current usage metrics show cumulative count of Article Views (full-text article views including HTML views, PDF and ePub downloads, according to the available data) and Abstracts Views on Vision4Press platform.
Data correspond to usage on the plateform after 2015. The current usage metrics is available 48-96 hours after online publication and is updated daily on week days.
Initial download of the metrics may take a while.