Fig. 1.
Download original image
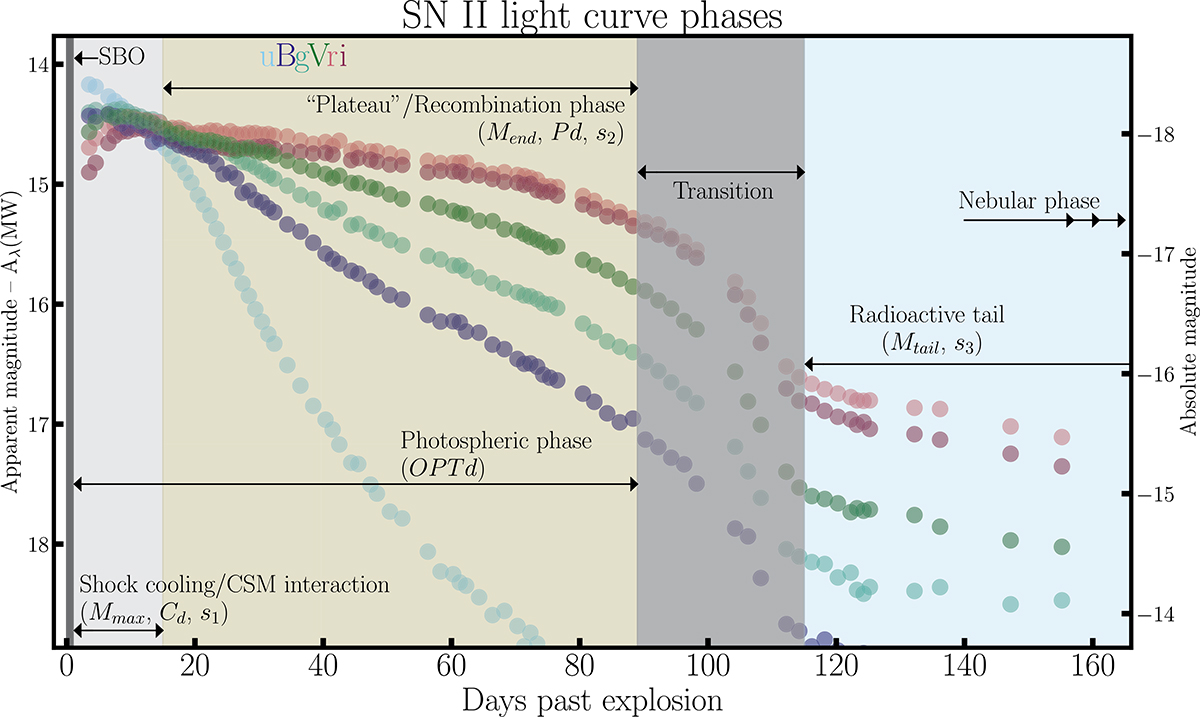
Optical wavelength light curves of an example SN II together with the labelling of the different light curve phases. The distinct shaded regions are used to define where different physical processes dominate the luminosity of SNe II (see details in text). The generic naming scheme used in the literature to label these phases is given, together with observational parameters used to characterise those phases in brackets (from A14 and Gutiérrez et al. 2017b). It should be noted that phase boundaries are not necessarily well defined – they change between different SNe II, and are shown here as distinct abrupt changes for visualisation purposes. (While ‘SBO’ – shock breakout – is labelled on this plot and discussed in the text, it is not observed for this example SN II, nor for any other event in our sample).
Current usage metrics show cumulative count of Article Views (full-text article views including HTML views, PDF and ePub downloads, according to the available data) and Abstracts Views on Vision4Press platform.
Data correspond to usage on the plateform after 2015. The current usage metrics is available 48-96 hours after online publication and is updated daily on week days.
Initial download of the metrics may take a while.