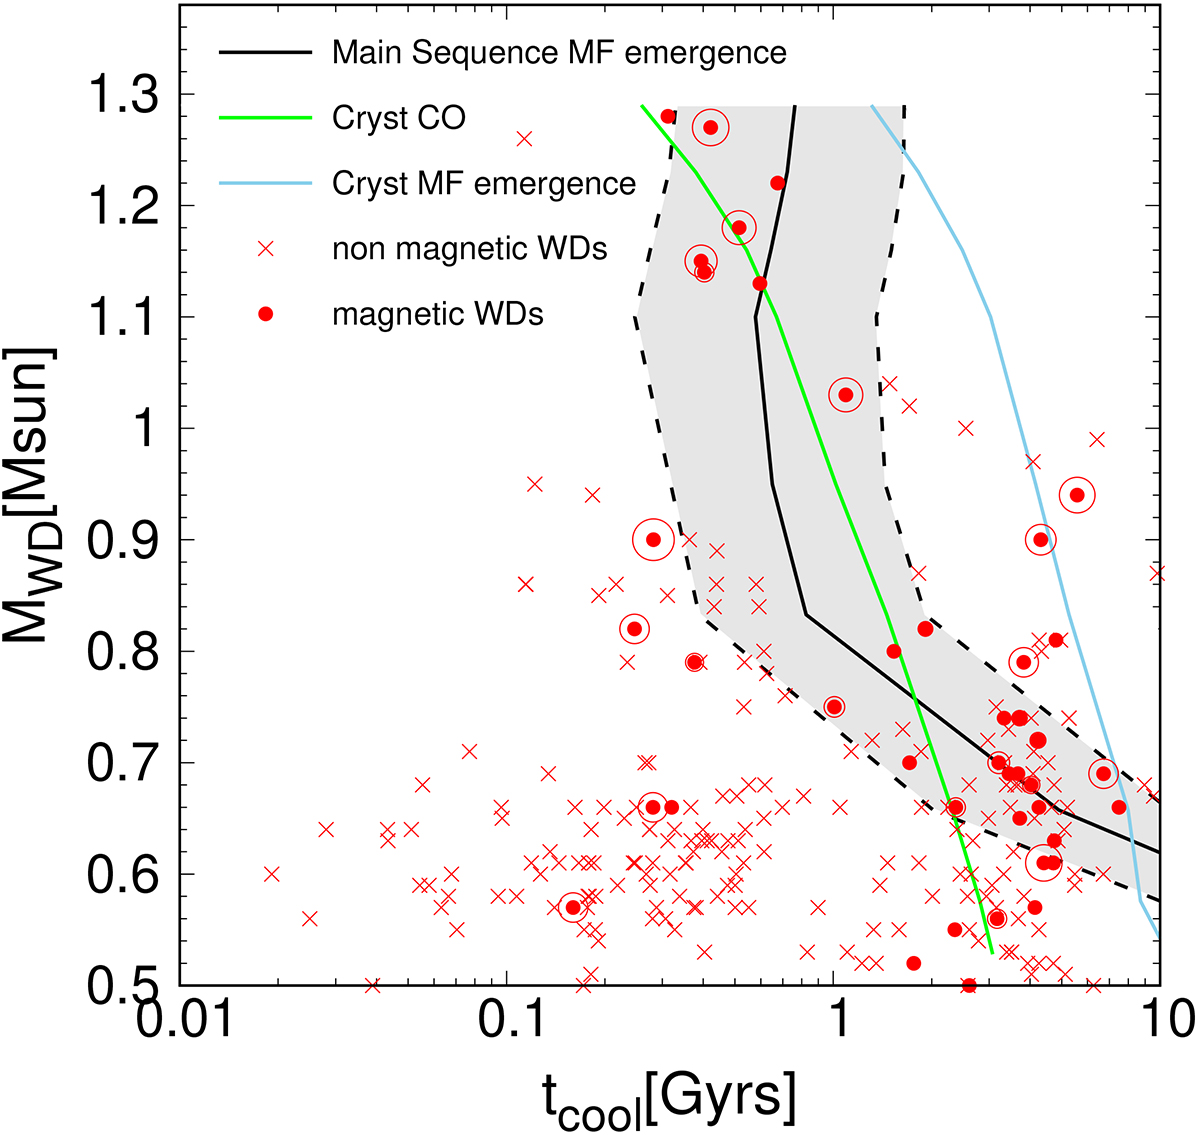
Fig. 3.
Download original image
Magnetic field breakout times for CO WDs. The crystallization onset is depicted with a green line and the magnetic field breakout time considering a crystallization-driven dynamo is plotted as a blue line. The magnetic breakout times considering a main sequence dynamo are shown with a black line for our cubic fit prescription, and the shaded area shows a deviation of ±0.3 from it. The magnetic (non-magnetic) WDs from the spectropolarimetric surveys of Bagnulo & Landstreet (2021, 2022) are plotted using filled red circles (red crosses), and the radius of the surrounding circles is proportional to the magnetic field amplitude. These spectropolarimetric surveys are volume limited up to 20 pc for all WDs and up to 40 pc for those WDs younger than 0.6 Gyr.
Current usage metrics show cumulative count of Article Views (full-text article views including HTML views, PDF and ePub downloads, according to the available data) and Abstracts Views on Vision4Press platform.
Data correspond to usage on the plateform after 2015. The current usage metrics is available 48-96 hours after online publication and is updated daily on week days.
Initial download of the metrics may take a while.