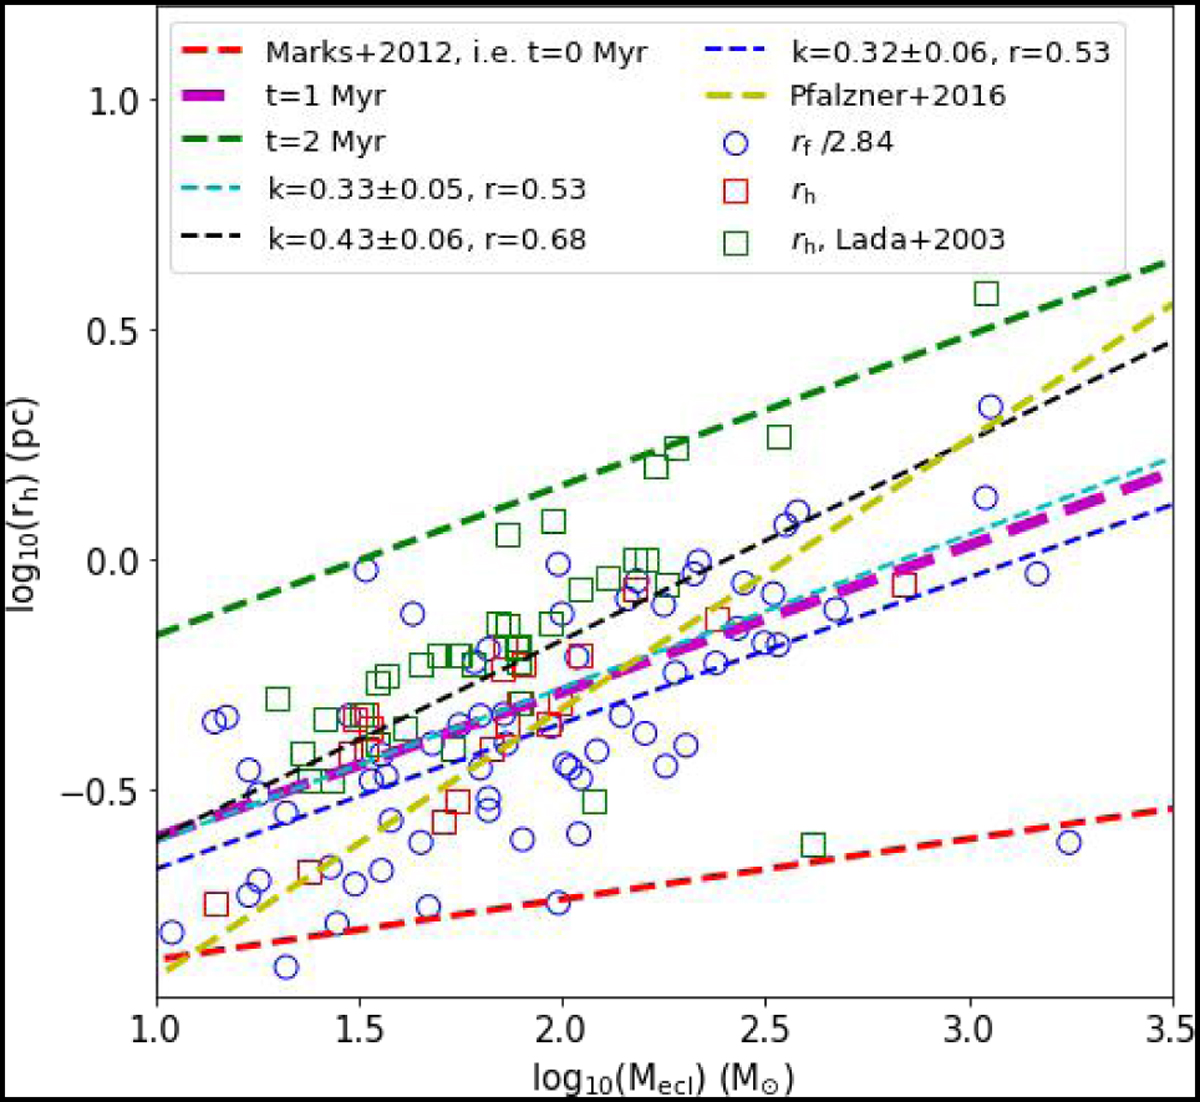
Fig. 5
Download original image
Fitting the mass–radius relation of embedded clusters in observations using N-body simulations. For the samples in Fig. 3, their radii were divided by 2.84, and then merged with the samples in Fig. 2. The radii of all samples were unified to the half-mass radius. The yellow dashed line is the mass–radius relation of Pfalzner et al. (2016). Dashed cyan, black, and blue lines represent the mass–radius relations of all samples, the samples in Lada et al. (1991); Carpenter et al. (1993); Lada & Lada (2003) and the samples in Carpenter (2000); Kumar et al. (2006); Faustini et al. (2009), respectively. Here, “k” is the slope of the fitting with the unit pc/M⊙, and “r” represents the Pearson correlation coefficient.
Current usage metrics show cumulative count of Article Views (full-text article views including HTML views, PDF and ePub downloads, according to the available data) and Abstracts Views on Vision4Press platform.
Data correspond to usage on the plateform after 2015. The current usage metrics is available 48-96 hours after online publication and is updated daily on week days.
Initial download of the metrics may take a while.