Fig. 4
Download original image
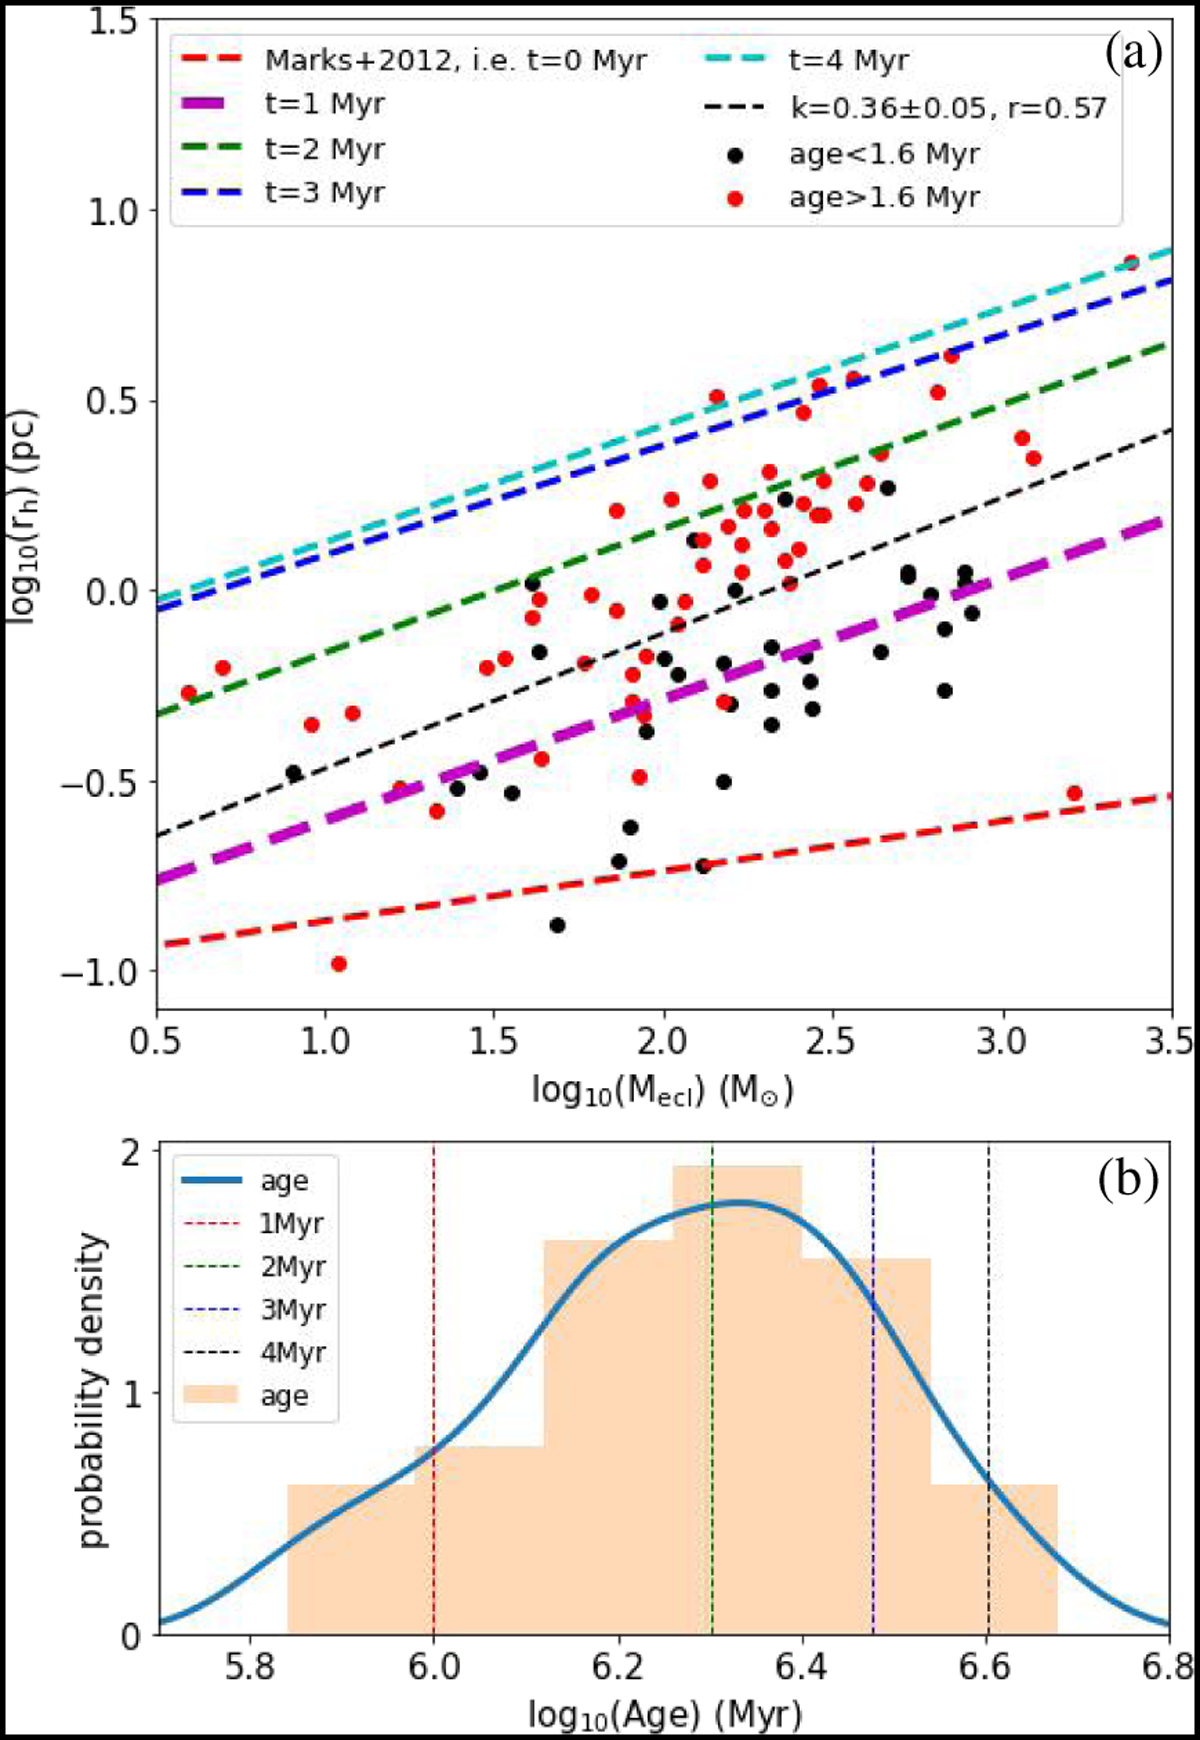
Fitting the mass–radius relation of embedded clusters in observations using N-body simulations. (a) Dashed lines are the rh–Mecl relations at different time nodes. Red and black dots represent the subclusters from Kuhn et al. (2014), which have ages of >1.6 Myr and <1.6 Myr, respectively. The dashed black line represents the fitted massradius relation. Here, “k” is the slope of the linear fitting with units of pc/M⊙, and “r” is the Pearson correlation coefficient. (b) Age distribution of the subclusters in Table 1 of Kuhn et al. (2015).
Current usage metrics show cumulative count of Article Views (full-text article views including HTML views, PDF and ePub downloads, according to the available data) and Abstracts Views on Vision4Press platform.
Data correspond to usage on the plateform after 2015. The current usage metrics is available 48-96 hours after online publication and is updated daily on week days.
Initial download of the metrics may take a while.