Fig. 3
Download original image
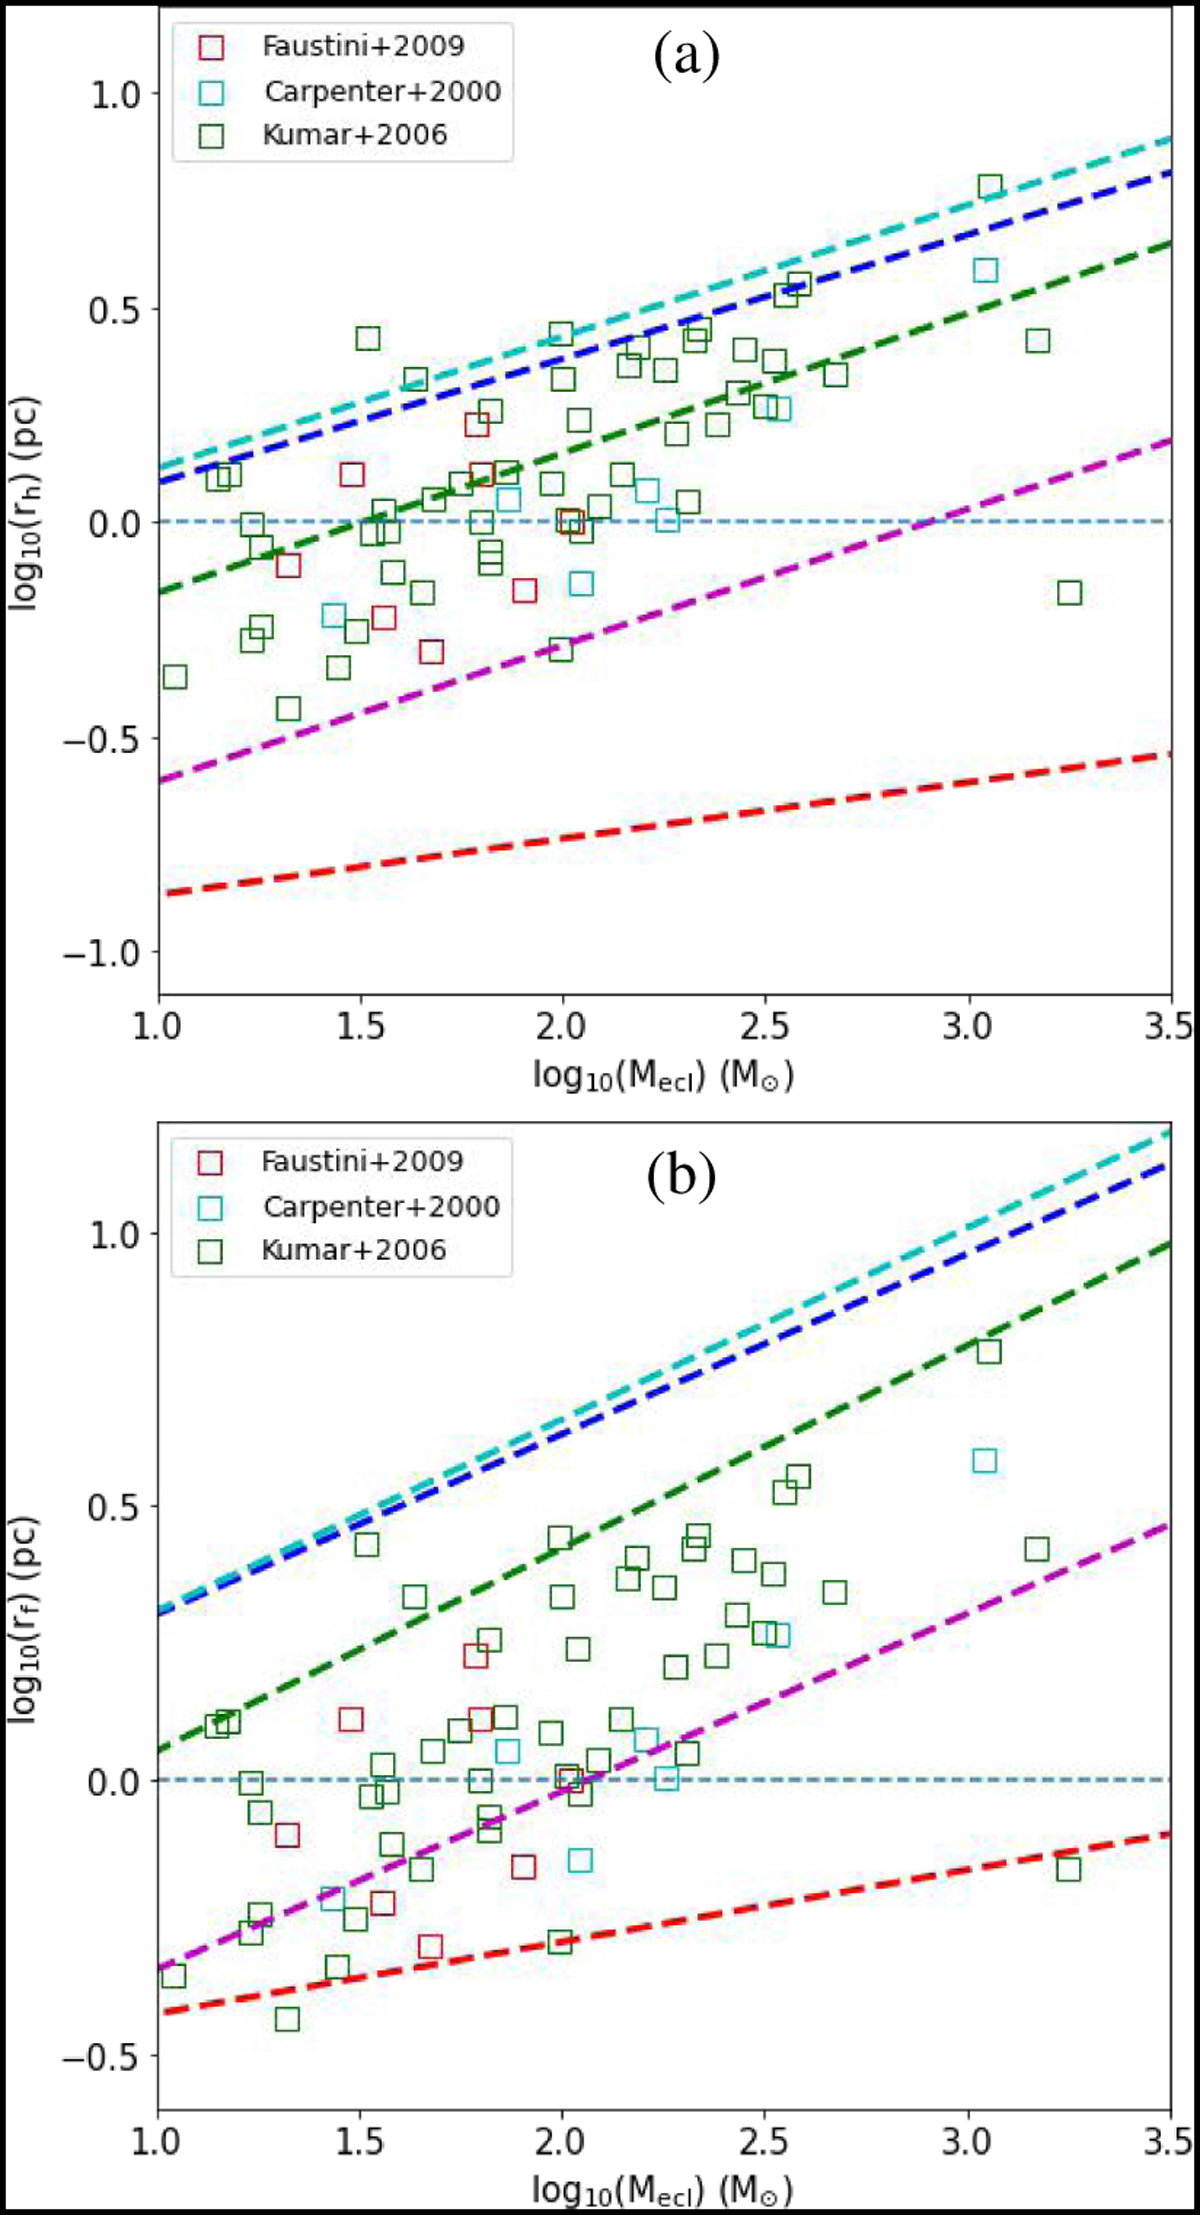
Fitting the mass–radius relation of embedded clusters in observations using N-body simulations. Colored squares represent the clusters from Carpenter (2000), Kumar et al. (2006) and Faustini et al. (2009). The horizontal line marks the position of the radius r = 1 pc. The dashed lines are color-coded according to age as in Figs. 1 and 2.
Current usage metrics show cumulative count of Article Views (full-text article views including HTML views, PDF and ePub downloads, according to the available data) and Abstracts Views on Vision4Press platform.
Data correspond to usage on the plateform after 2015. The current usage metrics is available 48-96 hours after online publication and is updated daily on week days.
Initial download of the metrics may take a while.