Fig. 2
Download original image
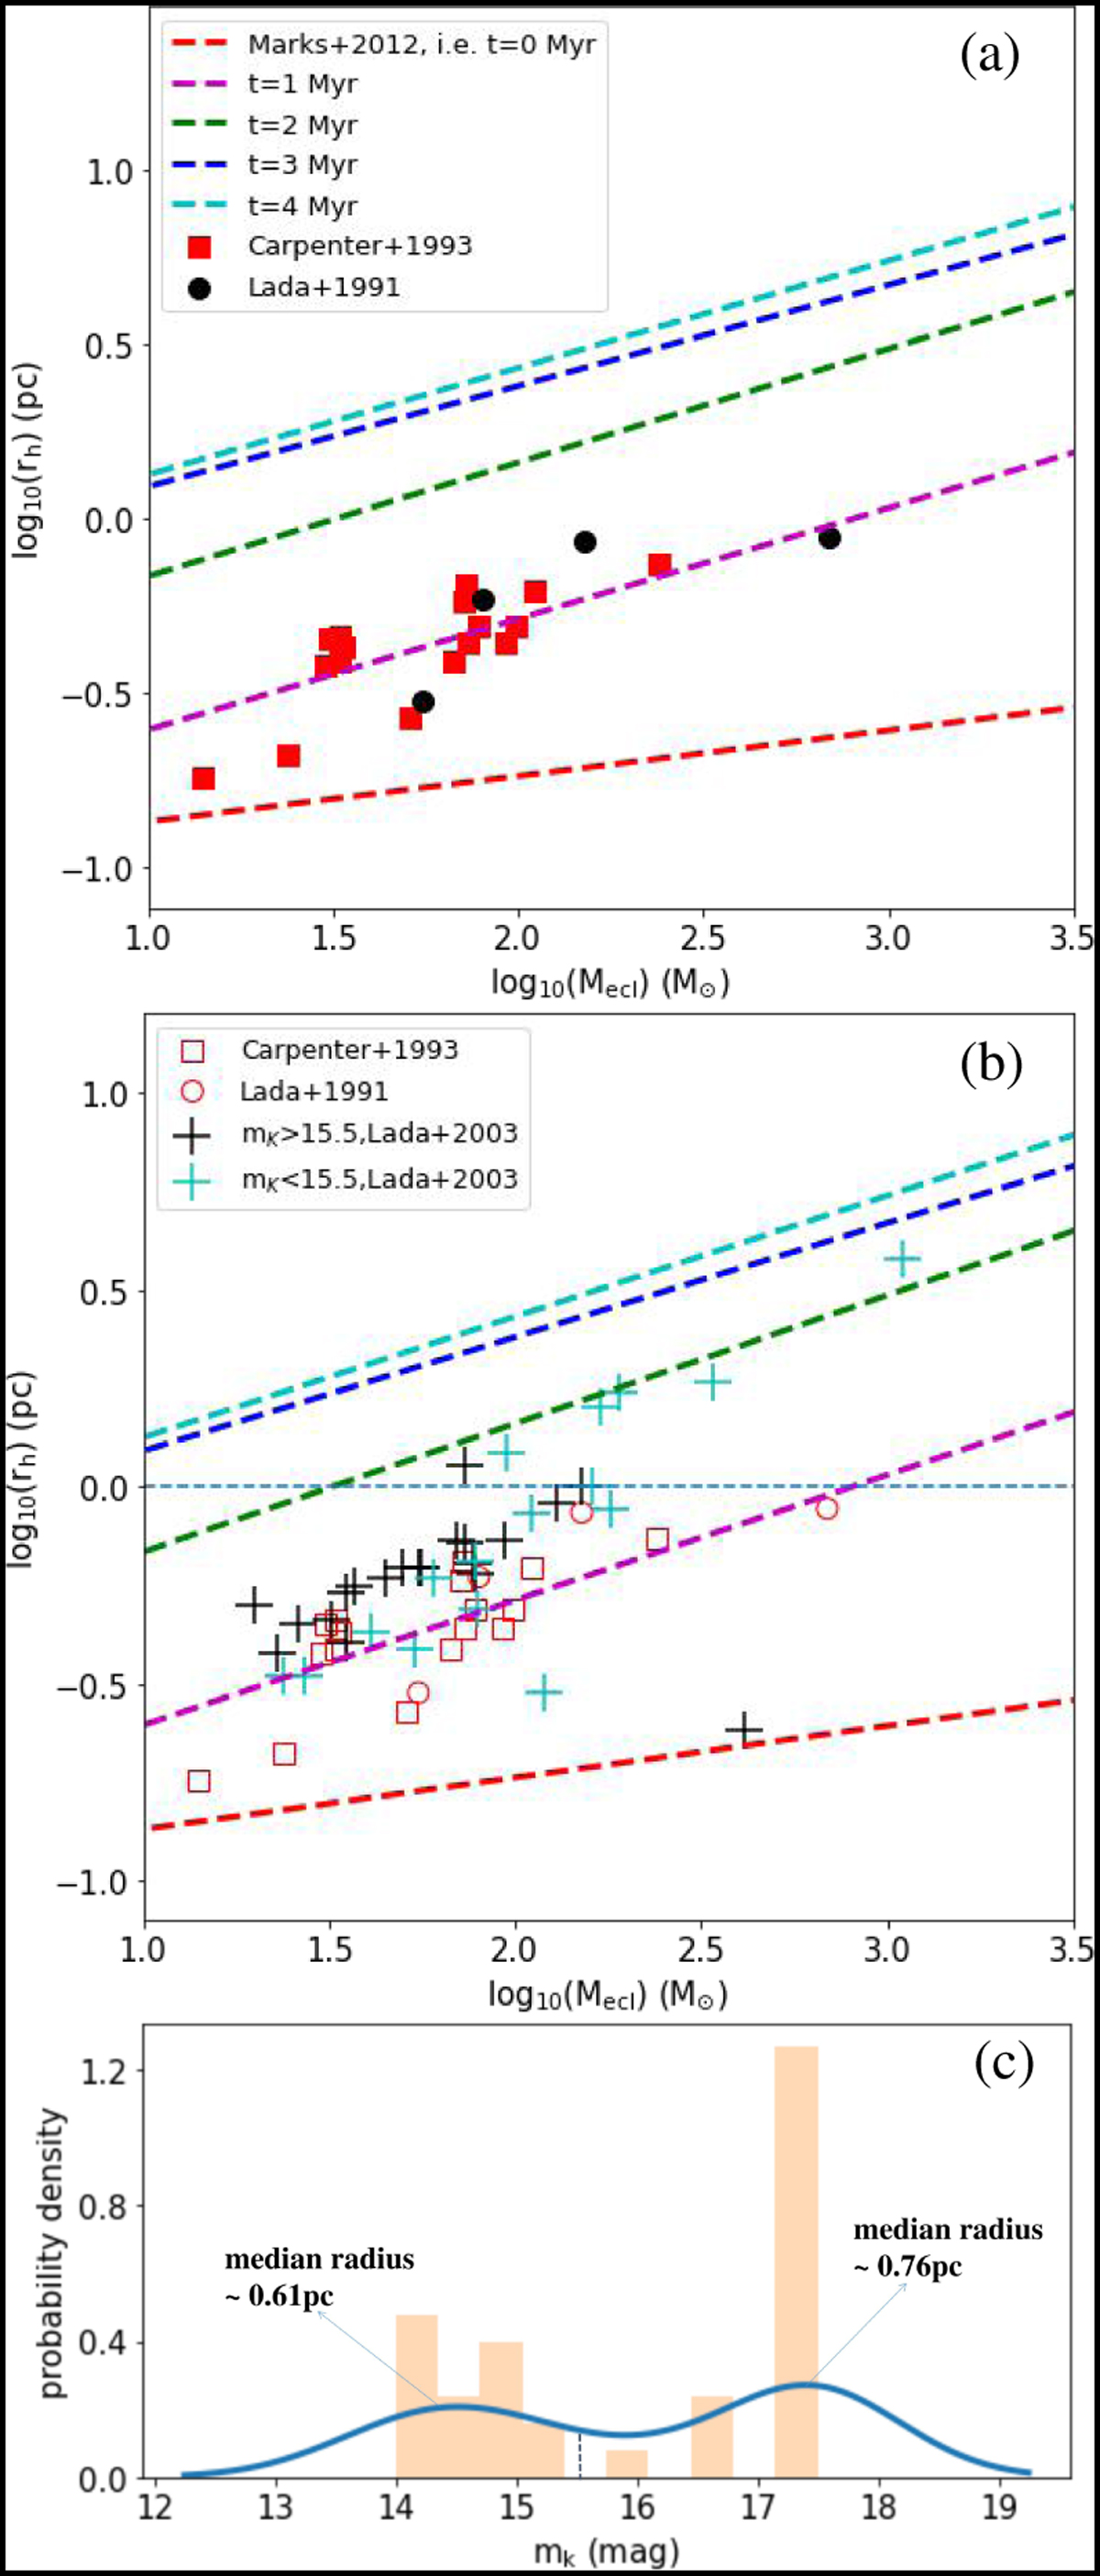
Fitting the mass–radius relation of embedded clusters in observations using N-body simulations. (a) Dashed lines are the rh − Mecl relations at different time nodes (t = 1 Myr, 2 Myr, 3 Myr and 4 Myr), i.e. the 1 Myr, 2 Myr, 3 Myr and 4 Myr expanding lines. Red squares and black dots represent the clusters from Carpenter et al. (1993) and Lada et al. (1991), respectively. (b) Plus symbols show the clusters from Lada & Lada (2003), while the black and red plus symbols show the clusters selected by the magnitude limits mK<15.5 and mK>15.5, respectively. The horizontal line marks the position of the radius r = 1 pc. (c) Distribution of the magnitude limits mK of the clusters in Lada & Lada (2003).
Current usage metrics show cumulative count of Article Views (full-text article views including HTML views, PDF and ePub downloads, according to the available data) and Abstracts Views on Vision4Press platform.
Data correspond to usage on the plateform after 2015. The current usage metrics is available 48-96 hours after online publication and is updated daily on week days.
Initial download of the metrics may take a while.