Open Access
Fig. 1
Download original image
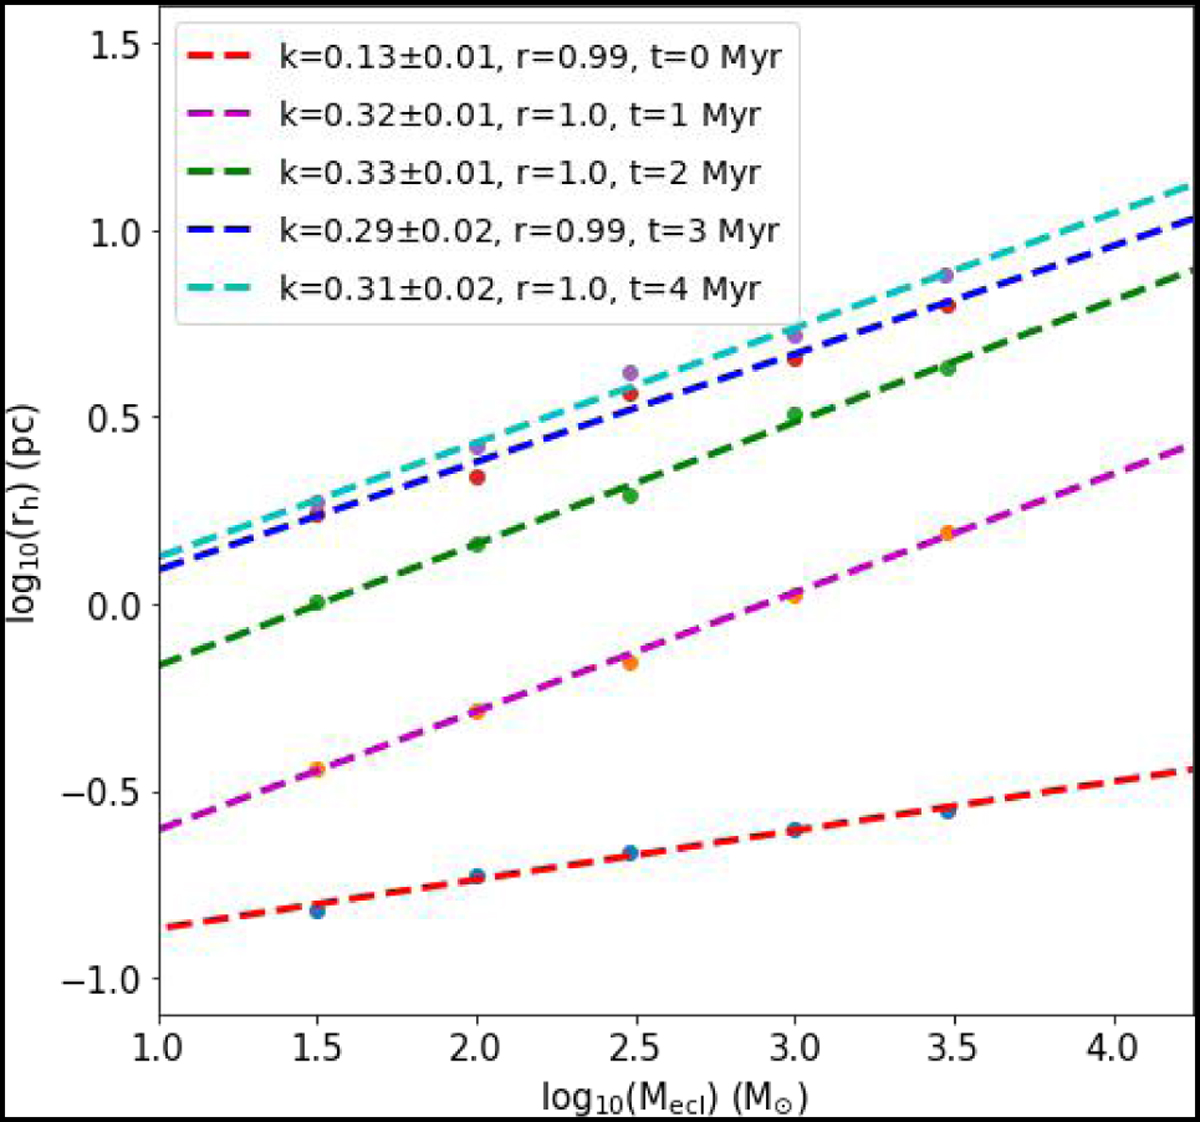
Fits to the expanding cluster in simulations by least-squares. The dots are from different time nodes; i.e., t = 0 Myr, 1 Myr, 2 Myr, 3 Myr, and 4 Myr. Here, “k” is the slope of the linear fit with the unit pc/M⊙, and “r” represents the Pearson correlation coefficient.
Current usage metrics show cumulative count of Article Views (full-text article views including HTML views, PDF and ePub downloads, according to the available data) and Abstracts Views on Vision4Press platform.
Data correspond to usage on the plateform after 2015. The current usage metrics is available 48-96 hours after online publication and is updated daily on week days.
Initial download of the metrics may take a while.