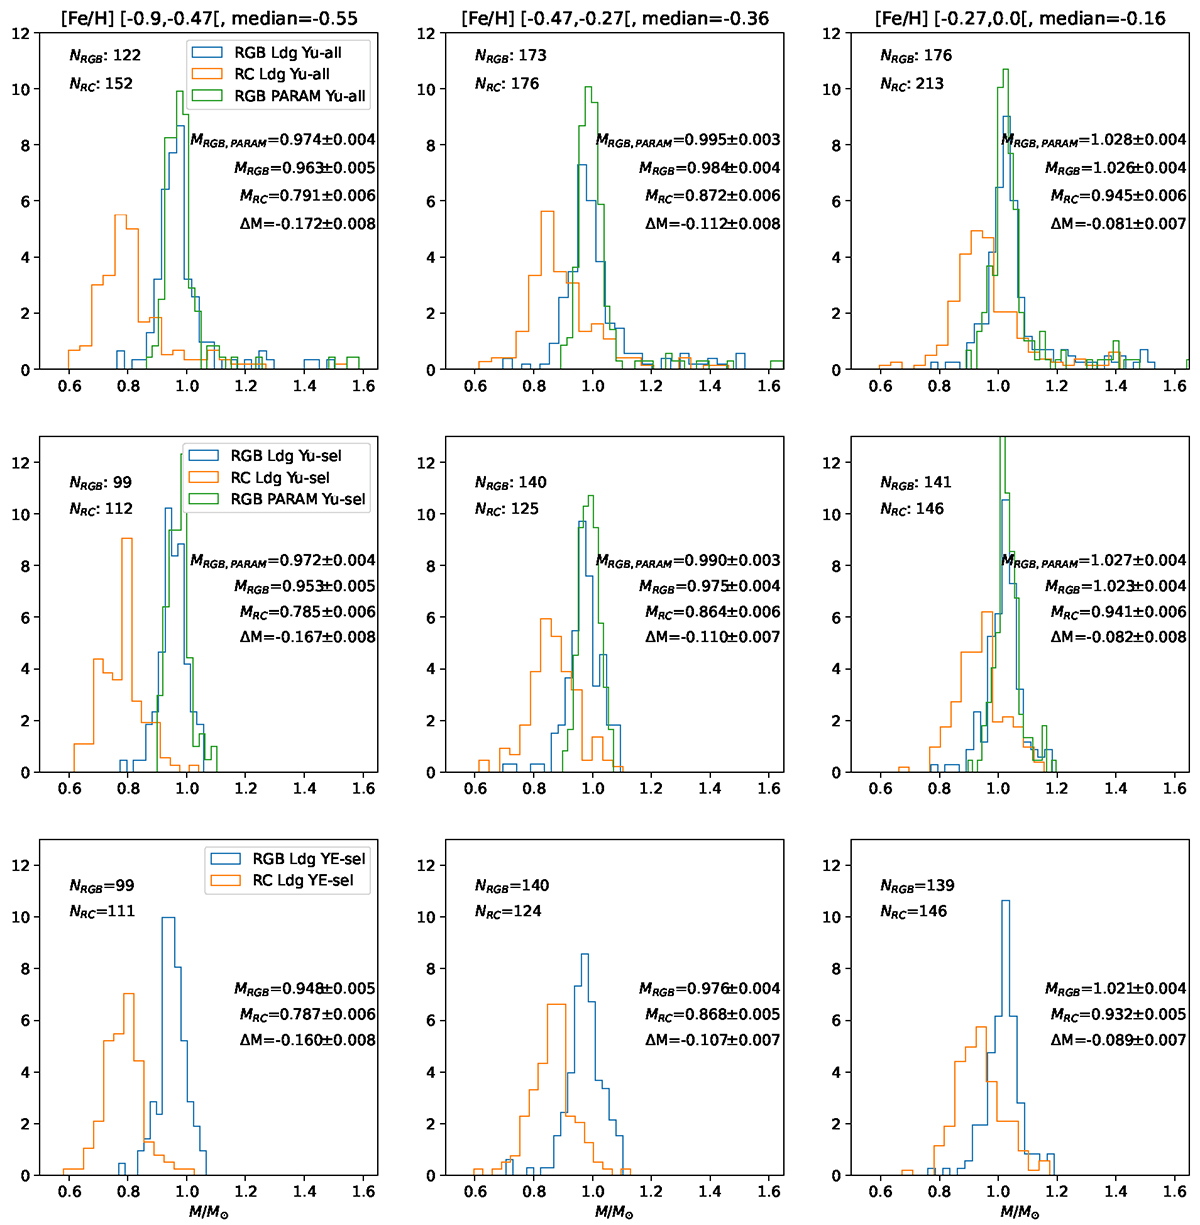
Fig. A.4.
Download original image
Mass distributions of stars in sub-samples of Kepler high-α stars at three different metallicities. The metallicity range and median metallicity in each panel is given above the top row. Each panel shows the mass distributions or RGB and RC stars separately, calculated using the scaling relation with νmax and luminosity, and for the RGB stars also the mass from PARAM with Δν and νmax as input. The number of stars the median mass values of each evolutionary phase are given. Also stated is the mass loss given as ΔM, the difference in mass between the RC and RGB phases. top panels: All stars in the sample. middle panels: With quality-cuts applied as described in the text. bottom panels: As middle panels, but using the average asteroseismic parameters from Elsworth et al. (2020) instead of Yu et al. (2018).
Current usage metrics show cumulative count of Article Views (full-text article views including HTML views, PDF and ePub downloads, according to the available data) and Abstracts Views on Vision4Press platform.
Data correspond to usage on the plateform after 2015. The current usage metrics is available 48-96 hours after online publication and is updated daily on week days.
Initial download of the metrics may take a while.