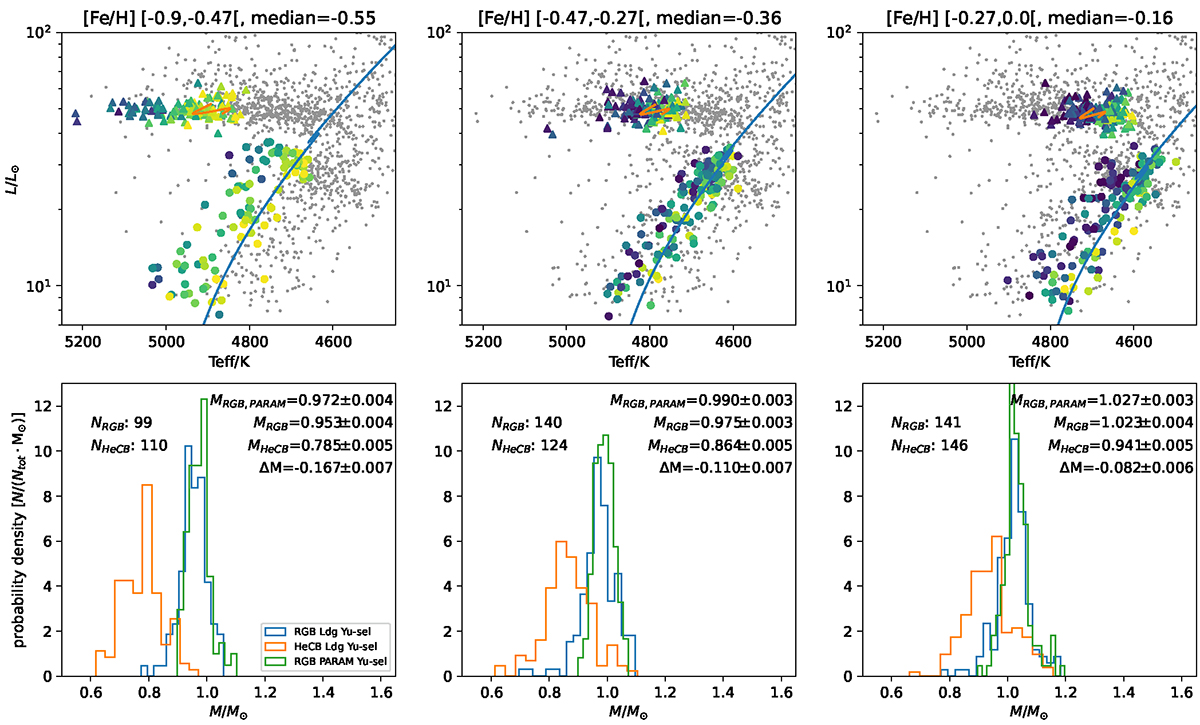
Fig. 1.
Download original image
Hertzsprung-Russell diagrams and mass distributions of Kepler high-α stars at three different metallicities. The [Fe/H] range and median in each panel is given at the top. Top panels: HR diagrams of the selected stars. The colour coding spans the metallicities in each bin with darker colours being more metal poor. Solid lines represent MESA models of the median [Fe/H], median [α/Fe], and median mass of each bin, shifted by −126 K, consistent with our analysis in Sect. 4.1. Bottom panels: The Kepler mass histograms based on asteroseismology from Yu et al. (2018) and Gaia DR3 parallax zero-points from Lindegren et al. (2021). The mass distributions of RGB and HeCB stars are calculated using Eq. (1), and for the RGB stars also using PARAM with Δν and νmax as input. The number of stars N and the median mass of each evolutionary phase are shown along with the mass loss, ΔM, the difference in median mass between the HeCB and RGB distributions.
Current usage metrics show cumulative count of Article Views (full-text article views including HTML views, PDF and ePub downloads, according to the available data) and Abstracts Views on Vision4Press platform.
Data correspond to usage on the plateform after 2015. The current usage metrics is available 48-96 hours after online publication and is updated daily on week days.
Initial download of the metrics may take a while.