Fig. 9.
Download original image
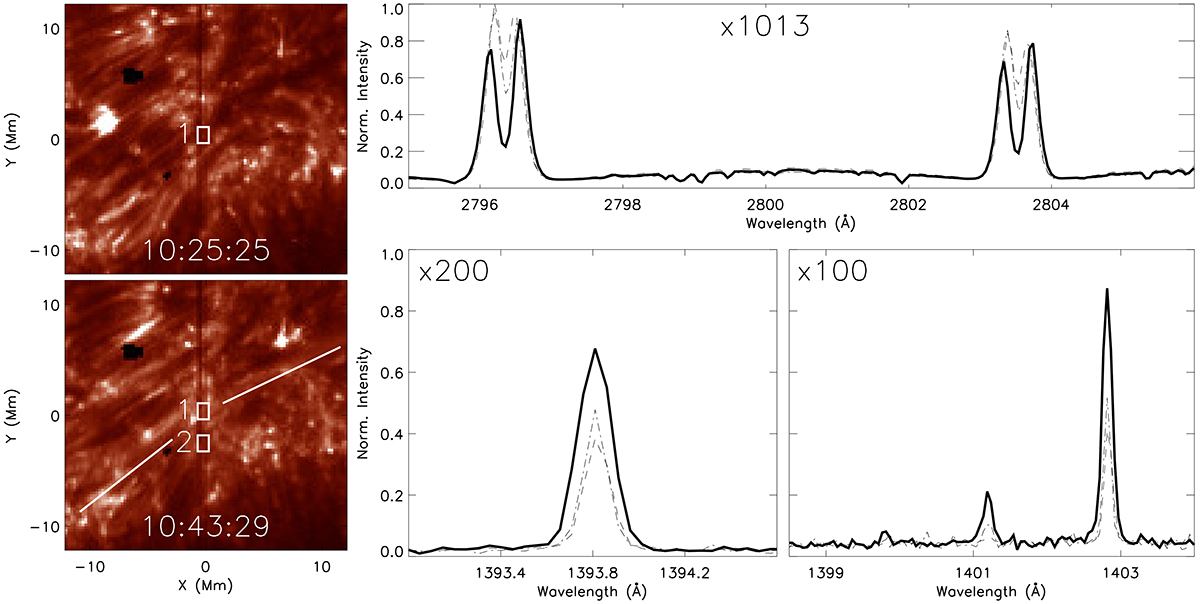
Differences between the IRIS spectra sampled before and after the SAA, corresponding to before and after the initial ejection of the surge. The left-hand panels plot the local FOV as sampled by the IRIS SJI 1400 Å filter before (top panel) and after the SAA (bottom panel). The white boxes labelled ‘1’ indicate the location of the surge on the spectrograph slit, whilst the box labelled ‘2’ is taken as a quiet background area. The two white lines indicate the approximate path of the surge across the FOV. The right hand panels plot spectra sampled in the Mg II windows (top panel), Si IV 1394 Å window (bottom left panel), and Si IV 1403 Å window (bottom right panel). The solid lines plot the spectra measured from box ‘1’ during the surge, whilst the dashed and dot-dashed lines plot the spectra measured from box ‘1’ before the surge and from box ‘2’, respectively. The specific multiplication factors for each plot are overlaid for reference.
Current usage metrics show cumulative count of Article Views (full-text article views including HTML views, PDF and ePub downloads, according to the available data) and Abstracts Views on Vision4Press platform.
Data correspond to usage on the plateform after 2015. The current usage metrics is available 48-96 hours after online publication and is updated daily on week days.
Initial download of the metrics may take a while.