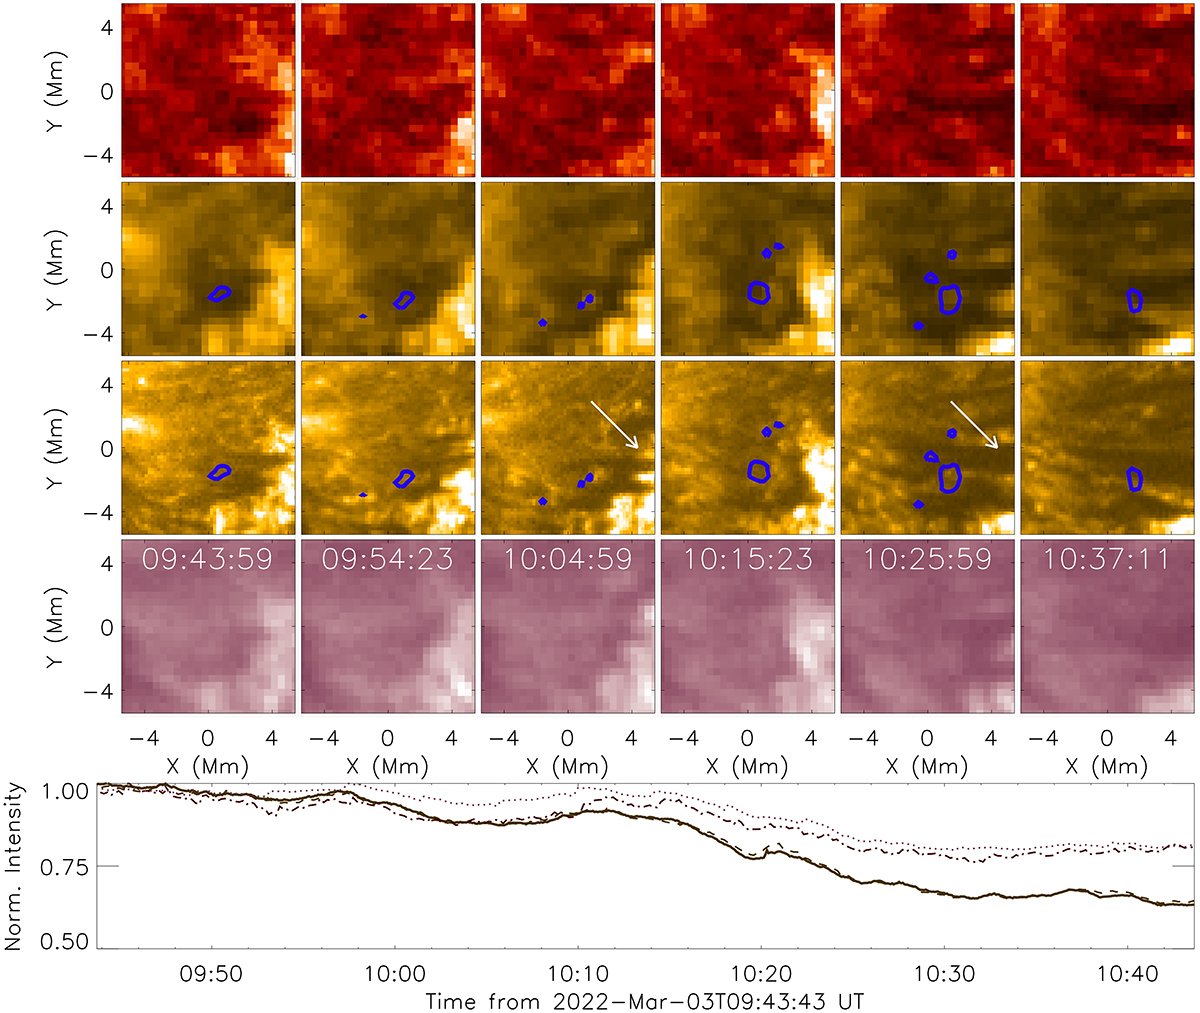
Fig. 6.
Download original image
Same of for Fig. 5 but for the SDO/AIA 304 Å channel (top row – dot-dashed line), SDO/AIA 171 Å channel (second row – dashed line), HRIEUV data (third row – solid line), and SDO/AIA 211 Å channel (fourth row – dotted line). No localised brightenings were detected co-spatial to the UV bursts identified previously; however, a reduction in the normalised mean intensity was seemingly associated with the ejection of surges from the reconnection site. The two arrows on the HRIEUV row indicate the first short surge extension (third column) and the second larger surge (fifth column), discussed in Sect. 3.3, that occurred co-spatial to the central UV burst within this FOV.
Current usage metrics show cumulative count of Article Views (full-text article views including HTML views, PDF and ePub downloads, according to the available data) and Abstracts Views on Vision4Press platform.
Data correspond to usage on the plateform after 2015. The current usage metrics is available 48-96 hours after online publication and is updated daily on week days.
Initial download of the metrics may take a while.