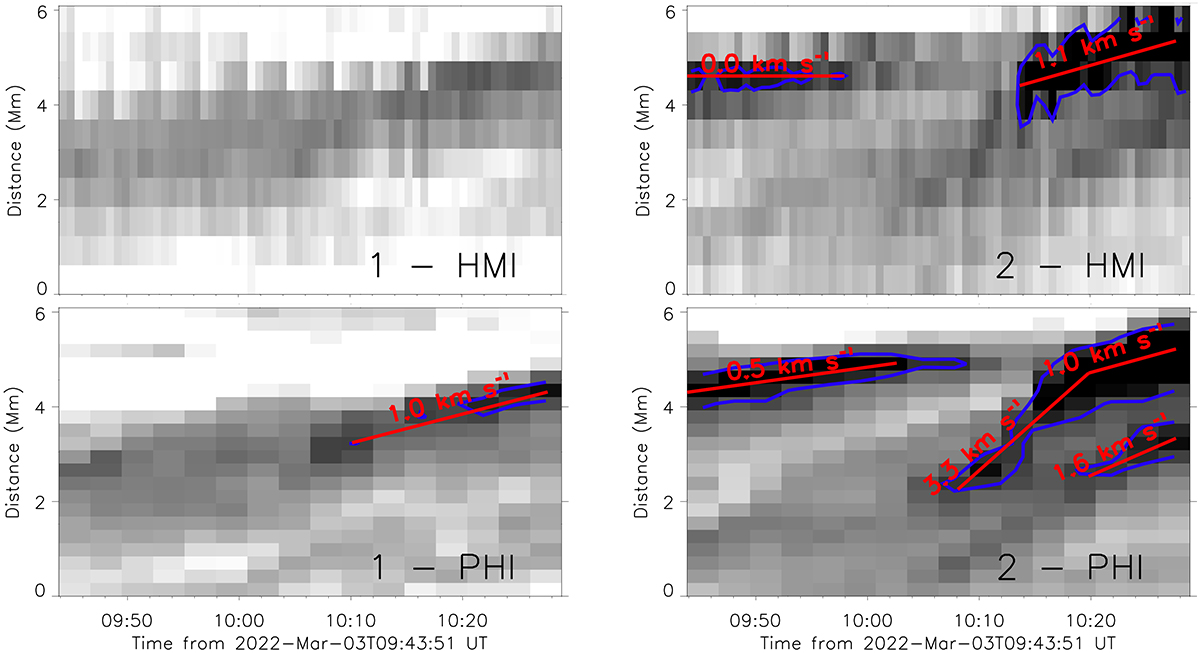
Fig. 4.
Download original image
Time-distance diagrams constructed along lines ‘1’ (left-hand panels) and ‘2’ (right-hand panels) overlaid on Fig. 3 for both SDO/HMI (top panels) and SO/PHI-HRT (bottom panels). The blue contours outline regions where the negative polarity MMFs are above an absolute value of 100 G, whilst the annotated red lines indicate the approximate speeds of these negative polarity MMFs.
Current usage metrics show cumulative count of Article Views (full-text article views including HTML views, PDF and ePub downloads, according to the available data) and Abstracts Views on Vision4Press platform.
Data correspond to usage on the plateform after 2015. The current usage metrics is available 48-96 hours after online publication and is updated daily on week days.
Initial download of the metrics may take a while.