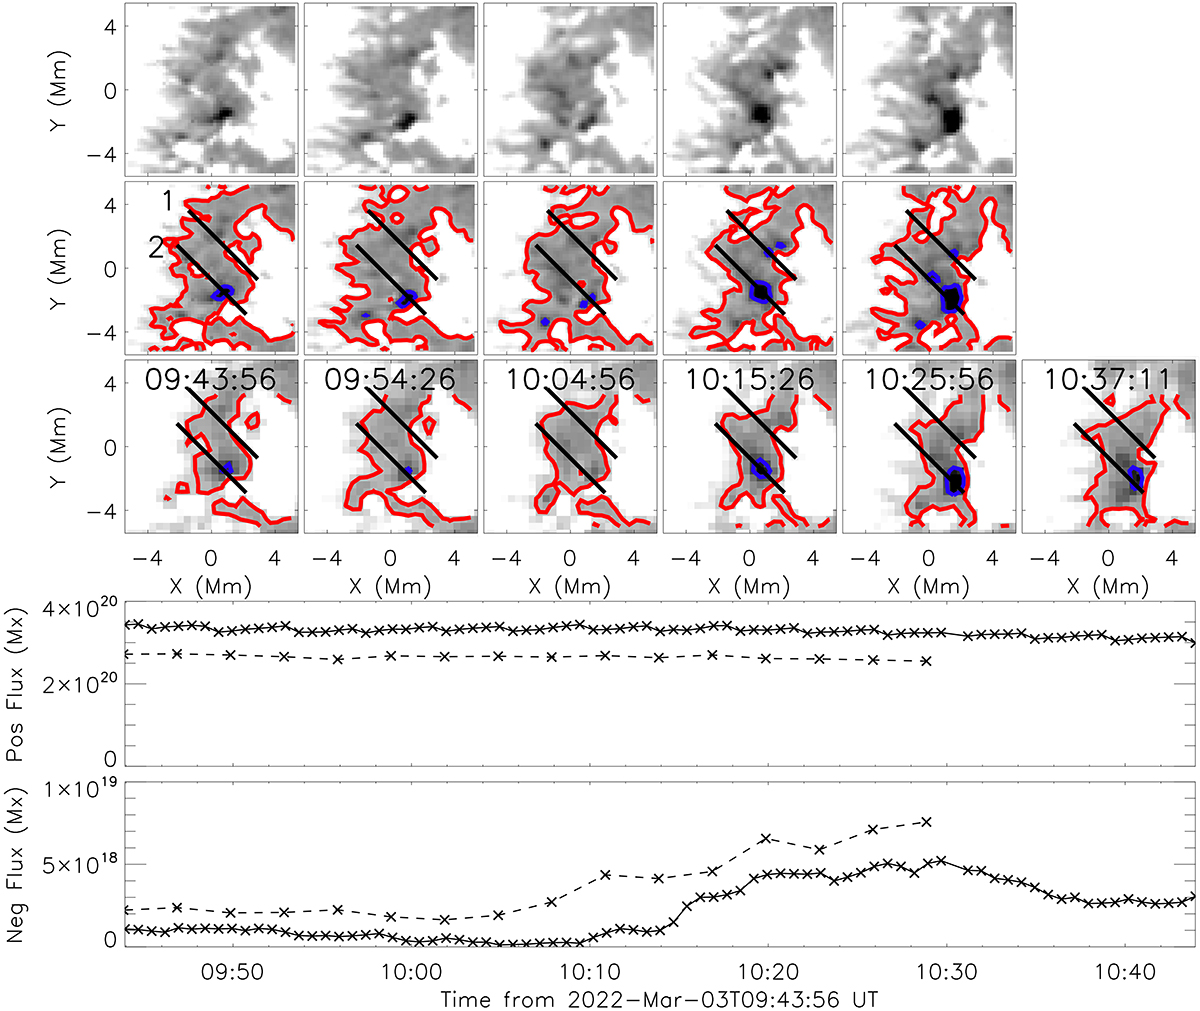
Fig. 3.
Download original image
Evolution of the line-of-sight magnetic field within the blue box overlaid on Fig. 2. The top row plots the FOV as sampled by SO/PHI-HRT, saturated at ±200 G, for five time-steps (the approximate times of which are overlaid on the third row). The second row plots the same as the top row but is annotated with contours outlining regions of ±100 G (red for positive and blue for negative polarities) and two lines (labelled as ‘1’ and ‘2’) that are used to construct the time-distance diagrams plotted in Fig. 4. The third row plots the FOV as measured by the SDO/HMI instrument, with the annotations being the same as in the second row. The fourth and fifth rows plot the evolution of the total positive polarity flux (fourth row) and negative polarity flux (fifth row) within the FOV through time as measured by SDO/HMI (solid line) and SO/PHI-HRT (dashed line). The crosses indicate individual measurements. The fourth and fifth rows are plotted with differing scales on the y-axes. We note that the step-like evolution of the SDO/HMI flux, particularly evident in the positive polarity flux plot, is an artefact introduced by the single-pixel derotation applied to those data through time. A movie more clearly displaying the evolution of this region (combined with Fig. 5) is included with the online version of this article.
Current usage metrics show cumulative count of Article Views (full-text article views including HTML views, PDF and ePub downloads, according to the available data) and Abstracts Views on Vision4Press platform.
Data correspond to usage on the plateform after 2015. The current usage metrics is available 48-96 hours after online publication and is updated daily on week days.
Initial download of the metrics may take a while.