Fig. 2.
Download original image
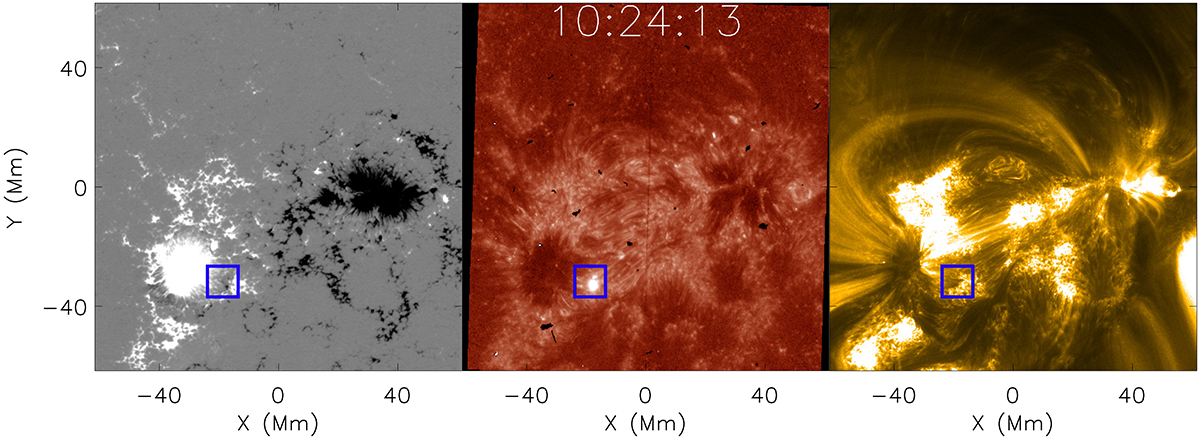
Structuring of AR 12957 in the line-of-sight magnetic field as observed by SO/PHI-HRT (left panel), the transition region as observed by the IRIS SJI 1400 Å filter (middle panel), and the corona as observed by the HRIEUV telescope (right panel). Each panel plots the frame sampled by each instrument closest to 10:24:13 UT. The SO/PHI-HRT line-of-sight magnetic field map is saturated at ±500 G, with white pixels indicating positive polarity and black pixels indicating negative polarity. The overlaid blue box indicates the FOV surrounding the grouping of UV bursts, located within the flow region around the trailing positive polarity sunspot, plotted in Figs. 3, 5 and 6.
Current usage metrics show cumulative count of Article Views (full-text article views including HTML views, PDF and ePub downloads, according to the available data) and Abstracts Views on Vision4Press platform.
Data correspond to usage on the plateform after 2015. The current usage metrics is available 48-96 hours after online publication and is updated daily on week days.
Initial download of the metrics may take a while.