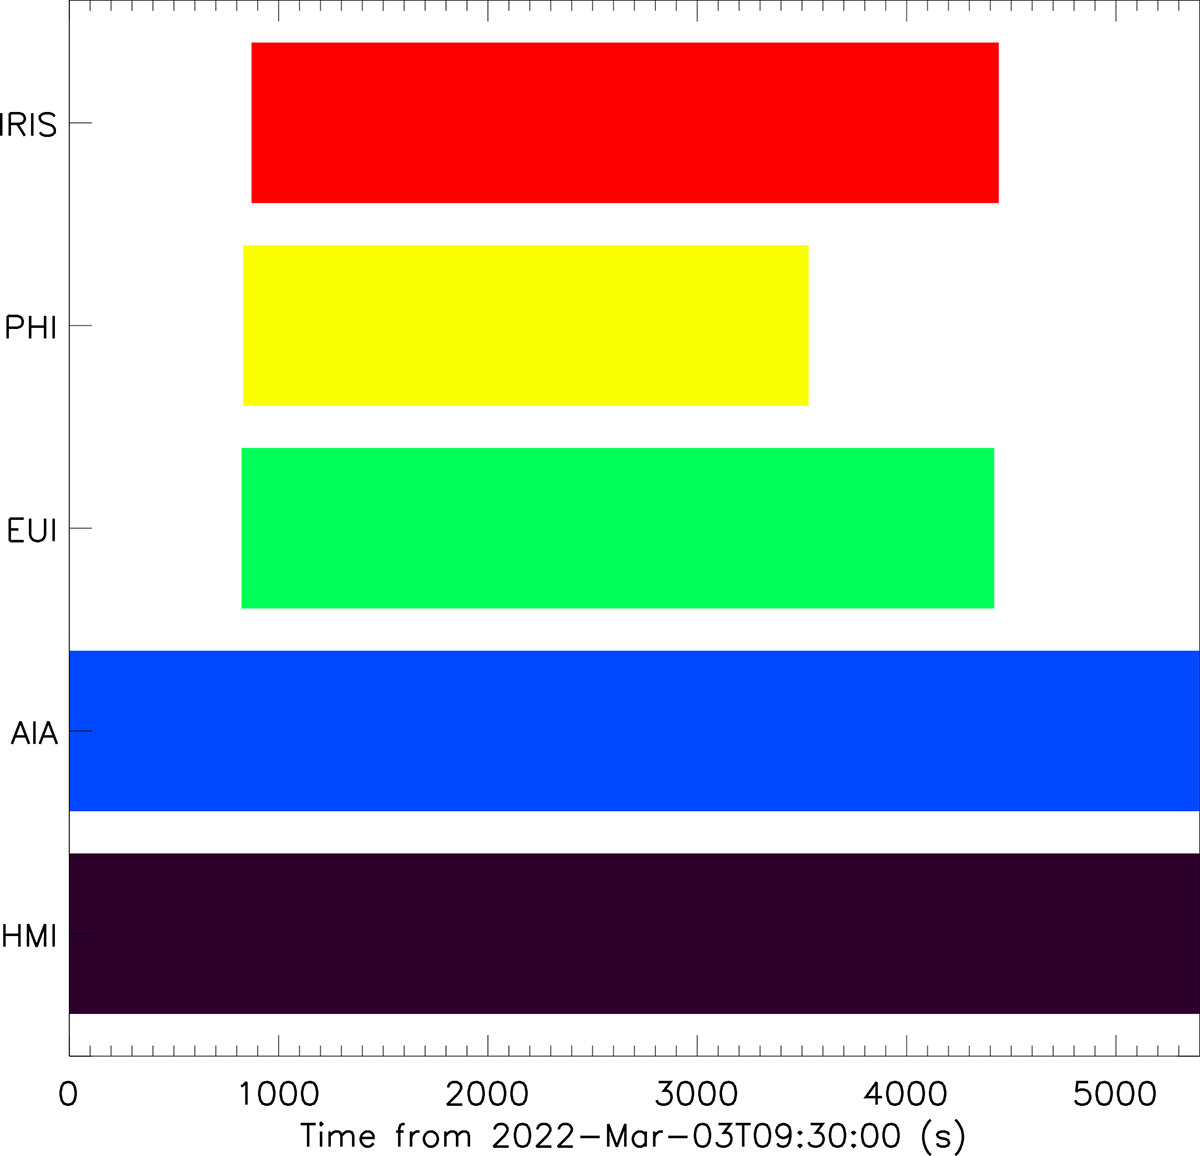
Fig. 1.
Download original image
Data availability for the five instruments analysed in this article. The filled bars indicate the times during which each instrument was sampling data, with the bars corresponding to EUI and PHI indicating, specifically, that the HRIEUV and SO/PHI-HRT telescopes were operating. A more detailed summary of these data can be found within Sect. 2.1.
Current usage metrics show cumulative count of Article Views (full-text article views including HTML views, PDF and ePub downloads, according to the available data) and Abstracts Views on Vision4Press platform.
Data correspond to usage on the plateform after 2015. The current usage metrics is available 48-96 hours after online publication and is updated daily on week days.
Initial download of the metrics may take a while.