Open Access
Fig. 2.
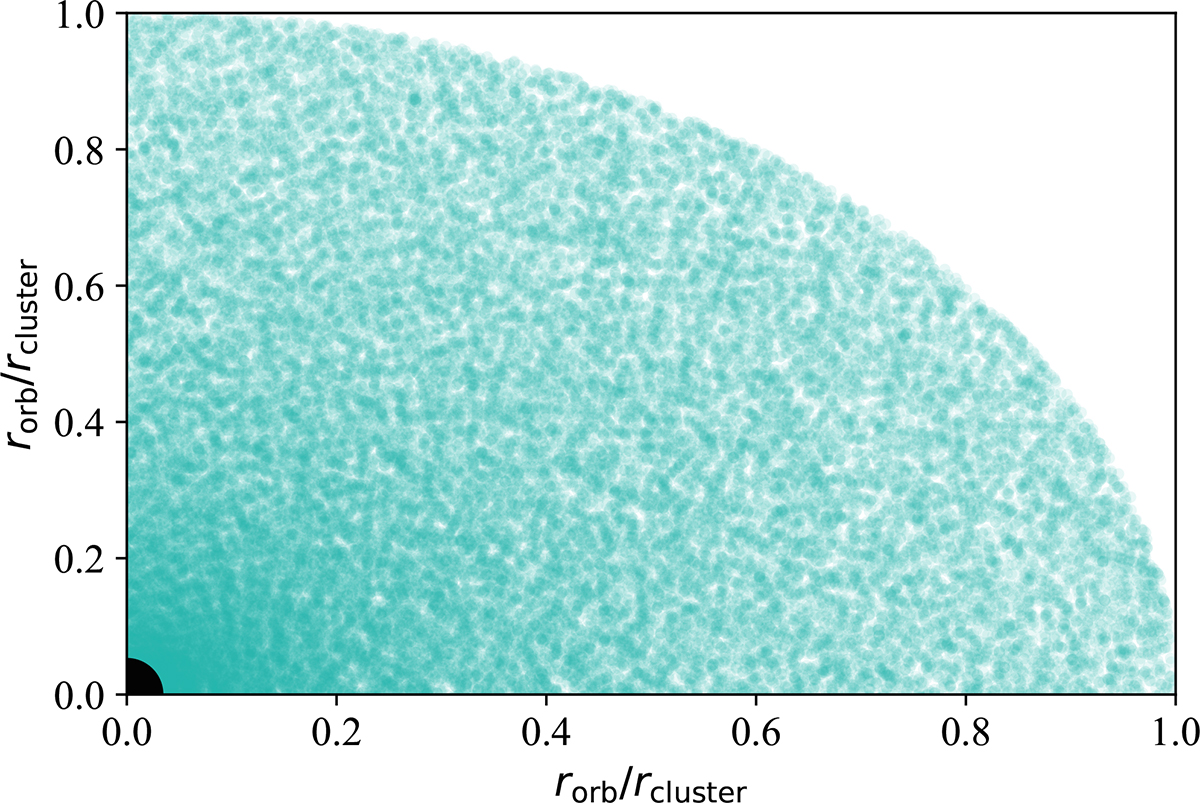
Download original image
Distribution of BHs within the cluster projected on the rz-plane, where each dot represents a BH of 10 M⊙. Both axes are on a linear scale and represent the distance rorb to the SMBH in units of the cluster radius. The SMBH (large black dot, not to scale) yields (0, 0).
Current usage metrics show cumulative count of Article Views (full-text article views including HTML views, PDF and ePub downloads, according to the available data) and Abstracts Views on Vision4Press platform.
Data correspond to usage on the plateform after 2015. The current usage metrics is available 48-96 hours after online publication and is updated daily on week days.
Initial download of the metrics may take a while.