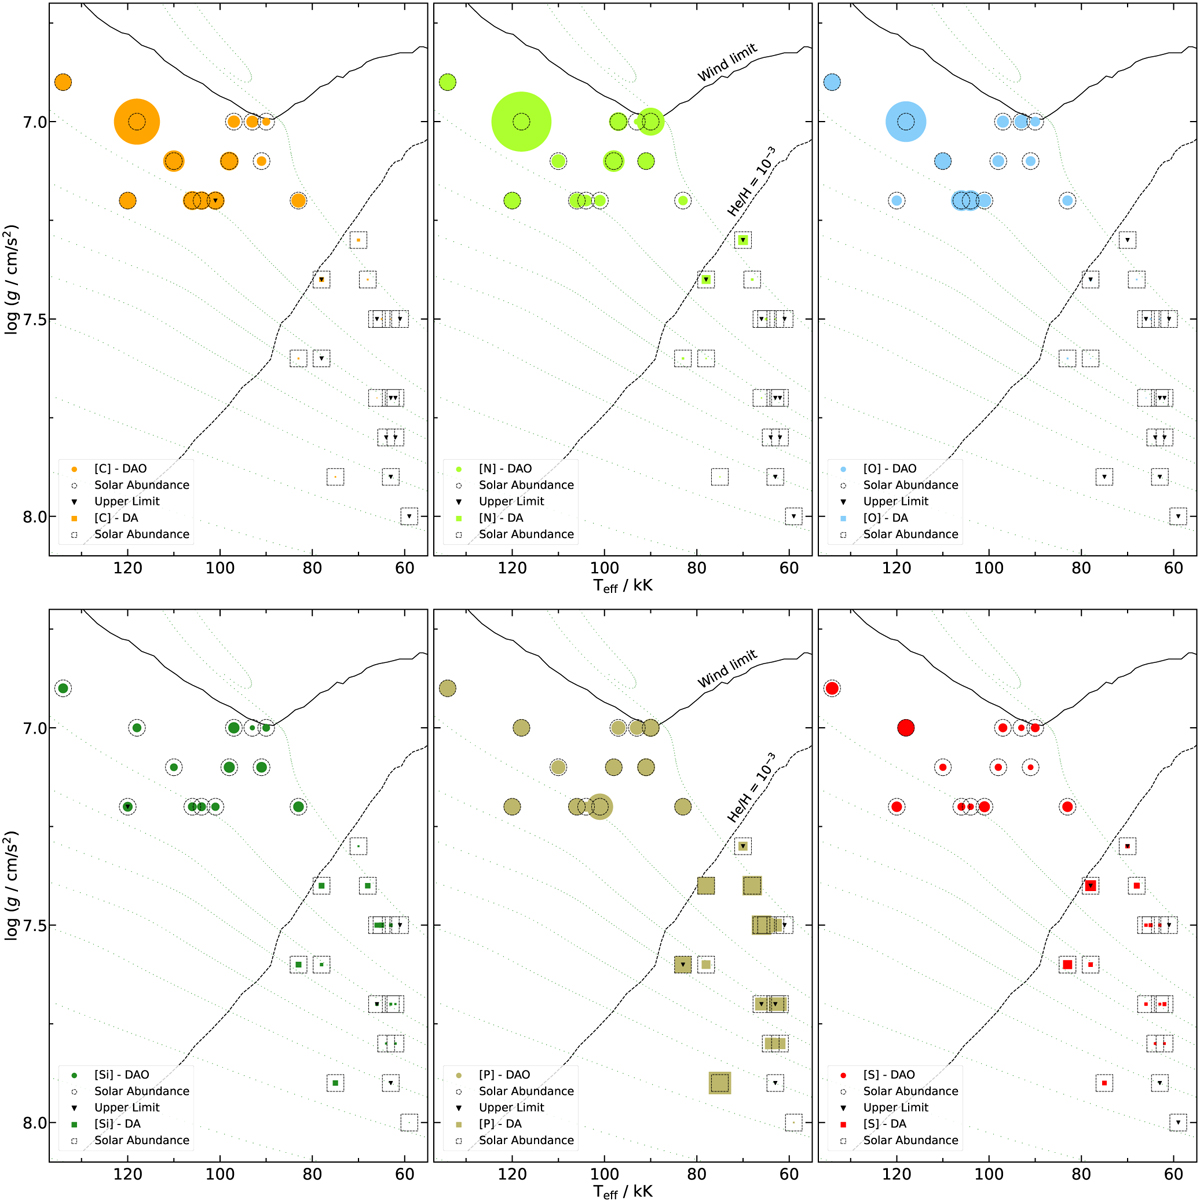
Fig. 9
Download original image
Element abundances of our sample objects in the Kiel diagram (panels from upper left to lower right: C, N, O, Si, P, and S). The abundances are illustrated with filled circles and squares for DAOs and DAs, respectively. The symbol size is proportional to the mass fraction of the respective element. The dashed symbols represent solar values (Asplund et al. 2009). The upper limits are marked with an upside triangle, which does not scale with the abundances.
Current usage metrics show cumulative count of Article Views (full-text article views including HTML views, PDF and ePub downloads, according to the available data) and Abstracts Views on Vision4Press platform.
Data correspond to usage on the plateform after 2015. The current usage metrics is available 48-96 hours after online publication and is updated daily on week days.
Initial download of the metrics may take a while.