Open Access
Fig. 7
Download original image
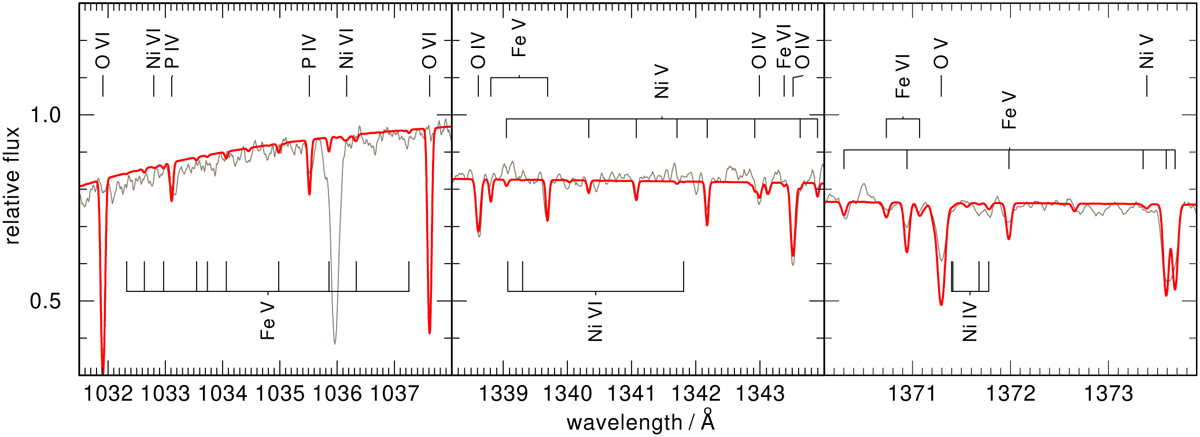
Sections of FUSE (left panel) and STIS (middle and right panels) spectra (gray) of the DA WD 0232+035 (red shows the model with Teff = 63 kK, log g = 7.5), illustrating stratification effects on oxygen ions.
Current usage metrics show cumulative count of Article Views (full-text article views including HTML views, PDF and ePub downloads, according to the available data) and Abstracts Views on Vision4Press platform.
Data correspond to usage on the plateform after 2015. The current usage metrics is available 48-96 hours after online publication and is updated daily on week days.
Initial download of the metrics may take a while.