Fig. 2
Download original image
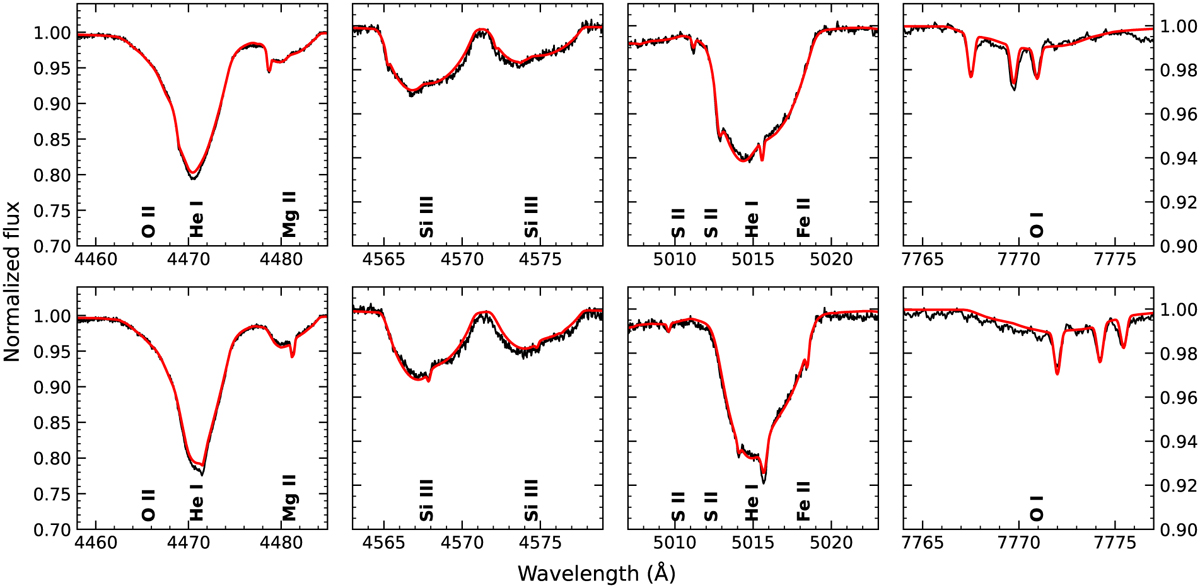
Detailed comparison of the helium and metal lines of the observed spectrum (black) with the global best-fitting solution (red) at different times. The spectra are shifted into the rest frame of the primary star (HD 37061 Aa). The plots in the first column have a different scaled flux axis. Top row: comparison with the spectrum used for the analysis, observed on March 8, 2007. Bottom row: comparison with a spectrum observed on January 12, 2006. The only difference between the models in the top and bottom row is the radial velocity shift of each stellar component.
Current usage metrics show cumulative count of Article Views (full-text article views including HTML views, PDF and ePub downloads, according to the available data) and Abstracts Views on Vision4Press platform.
Data correspond to usage on the plateform after 2015. The current usage metrics is available 48-96 hours after online publication and is updated daily on week days.
Initial download of the metrics may take a while.