Fig. 1
Download original image
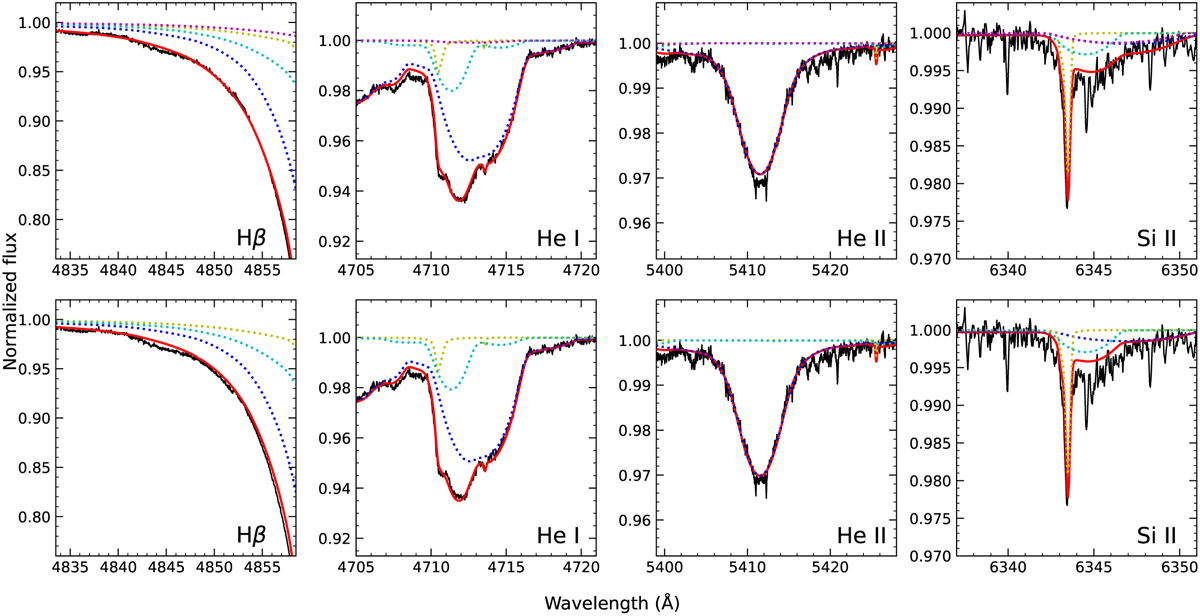
Comparison between the observed spectrum (black) and the synthetic model spectrum (red). The weighted individual contributions of HD 37061 Aa, Ab, B, and C are shown in dotted blue, yellow, magenta, and cyan, respectively. Top row. the model contains the spectral contributions of all four stars. Bottom row. the model excluding the spectral contribution of HD 37061 B.
Current usage metrics show cumulative count of Article Views (full-text article views including HTML views, PDF and ePub downloads, according to the available data) and Abstracts Views on Vision4Press platform.
Data correspond to usage on the plateform after 2015. The current usage metrics is available 48-96 hours after online publication and is updated daily on week days.
Initial download of the metrics may take a while.