Fig. 2.
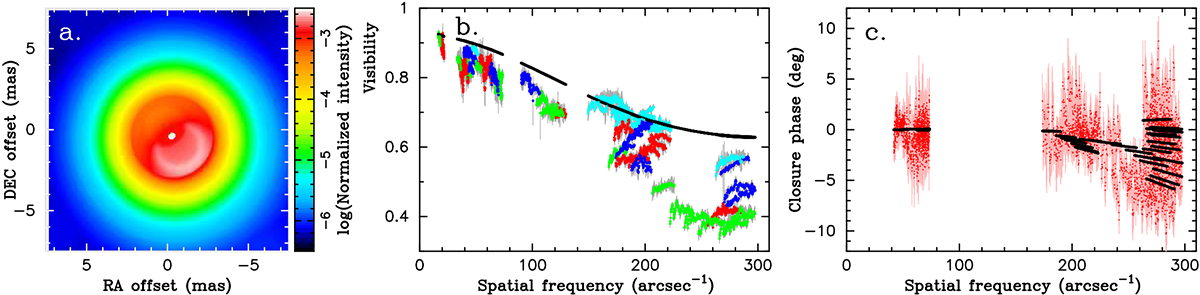
Download original image
Comparison of the dust torus model of Ohnaka et al. (2008) with the GRAVITY data. a: image predicted by the dust torus model at 2.2 μm with an inclination angle of 20°. Note that the central star’s intensity (white dot at the center) is at least ∼400 times higher than that of the torus. North is up, east is to the left. b: comparison of the visibility between the dust torus model and the GRAVITY data. The black dots (they appear to be solid lines due to the high density) represent the 2.2 μm visibilities predicted by the dust torus model. The dots with the error bars represent the GRAVITY data with the position angle (PA) of the projected baseline color-coded: red (0° ≤ PA < 45°), green (45° ≤ PA < 90°), blue (90° ≤ PA < 135°), and light blue (135° ≤ PA < 180°). c: comparison of the closure phase between the dust torus model and the GRAVITY data. The model closure phases are shown in black, while the measurements are plotted with the red dots with the error bars.
Current usage metrics show cumulative count of Article Views (full-text article views including HTML views, PDF and ePub downloads, according to the available data) and Abstracts Views on Vision4Press platform.
Data correspond to usage on the plateform after 2015. The current usage metrics is available 48-96 hours after online publication and is updated daily on week days.
Initial download of the metrics may take a while.