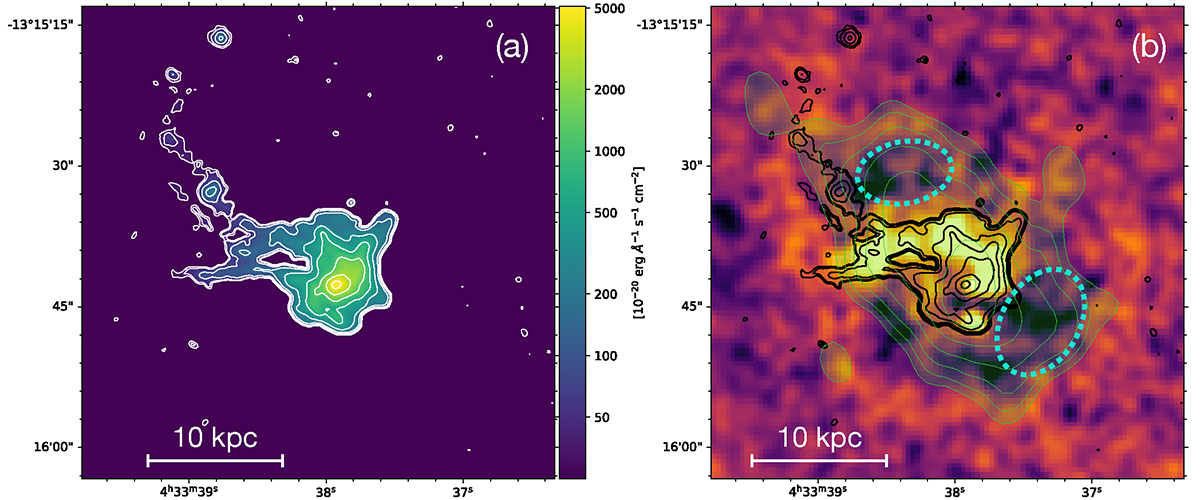
Fig. 9.
Download original image
Interaction between the warm gas, the ICM, and the radio source in A496. (a) MUSE image of the Hα line intensity, with overlaid white contours. (b) Chandra unsharp masked image of A496, obtained by subtracting a 10″σ smoothed image from a 2″σ smoothed one. Green contours are from the VLITE at 340 MHz at levels of 2, 4, 8, 16, 32, 64, and 128 mJy/beam, while black contours are from panel (a). Dashed cyan ellipses show the positions of the cavities excavated by the inner lobes (see Sect. 6).
Current usage metrics show cumulative count of Article Views (full-text article views including HTML views, PDF and ePub downloads, according to the available data) and Abstracts Views on Vision4Press platform.
Data correspond to usage on the plateform after 2015. The current usage metrics is available 48-96 hours after online publication and is updated daily on week days.
Initial download of the metrics may take a while.