Fig. 7.
Download original image
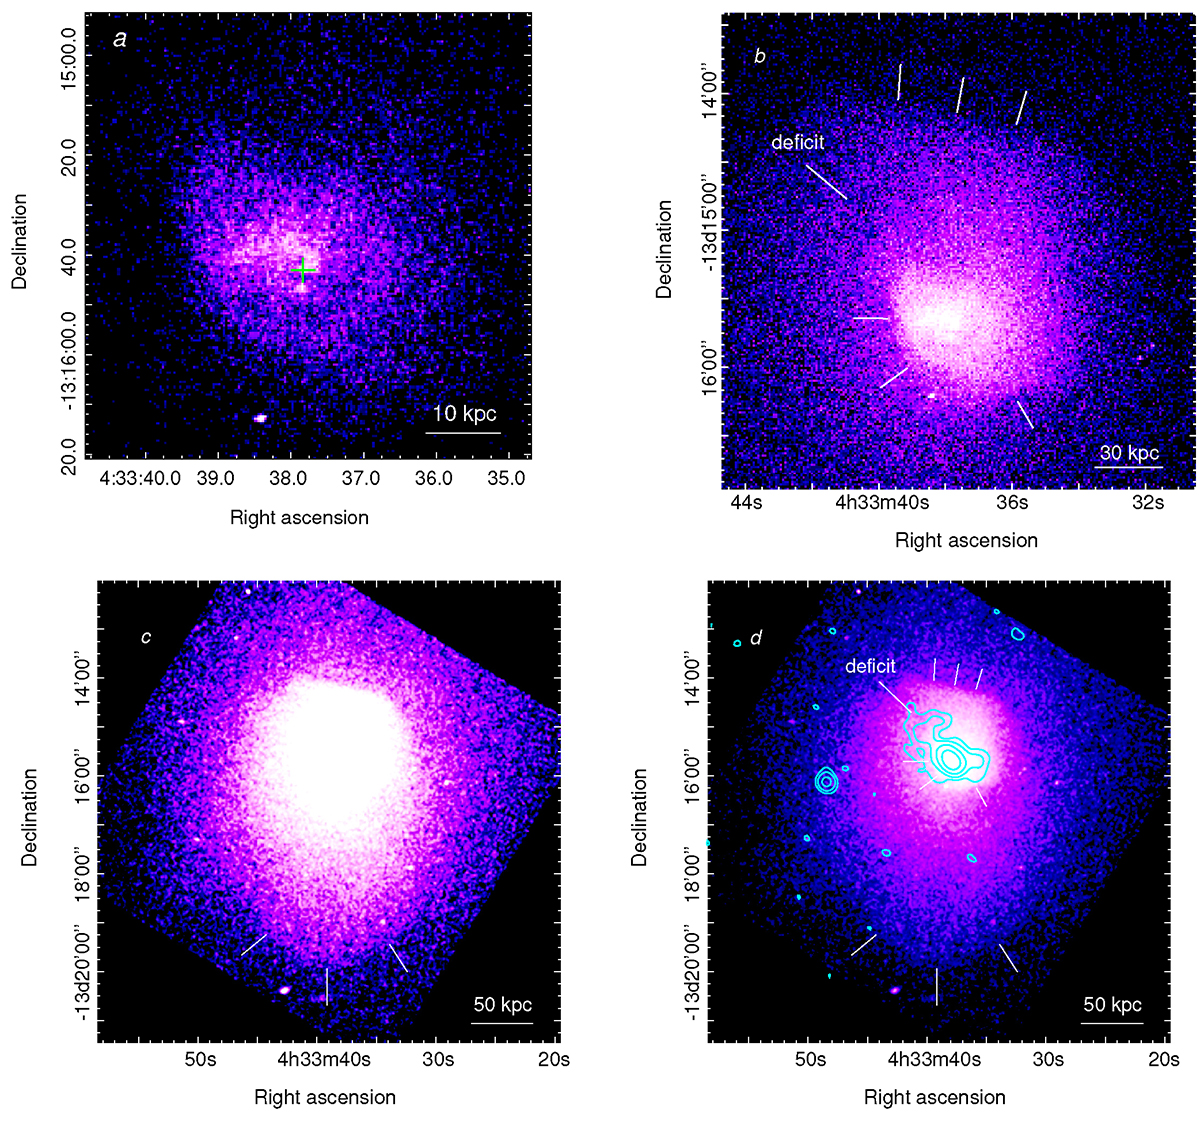
Large-scale Chandra images of A496. (a) Chandra 0.5–4 keV image of the central 60 kpc × 60 kpc region of A496, smoothed with a ![]() Gaussian. The green cross marks the location of the cD galaxy. (b) Chandra 0.5–4 keV image of the central 140 kpc × 140 kpc region. White lines mark the position of the inner cold fronts. (c) Chandra 0.5–4 keV image of the whole cool core, smoothed with a σ = 1″ Gaussian. White lines mark the position of the outermost cold front. (d) GMRT 330 MHz contours from Fig. 3a at levels of 1.8, 7.2, 28.8, and 115.2 mJy/beam (12″ resolution), overlaid on the Chandra 0.5–4 keV image, smoothed with a σ = 1″ Gaussian.
Gaussian. The green cross marks the location of the cD galaxy. (b) Chandra 0.5–4 keV image of the central 140 kpc × 140 kpc region. White lines mark the position of the inner cold fronts. (c) Chandra 0.5–4 keV image of the whole cool core, smoothed with a σ = 1″ Gaussian. White lines mark the position of the outermost cold front. (d) GMRT 330 MHz contours from Fig. 3a at levels of 1.8, 7.2, 28.8, and 115.2 mJy/beam (12″ resolution), overlaid on the Chandra 0.5–4 keV image, smoothed with a σ = 1″ Gaussian.
Current usage metrics show cumulative count of Article Views (full-text article views including HTML views, PDF and ePub downloads, according to the available data) and Abstracts Views on Vision4Press platform.
Data correspond to usage on the plateform after 2015. The current usage metrics is available 48-96 hours after online publication and is updated daily on week days.
Initial download of the metrics may take a while.