Fig. 6.
Download original image
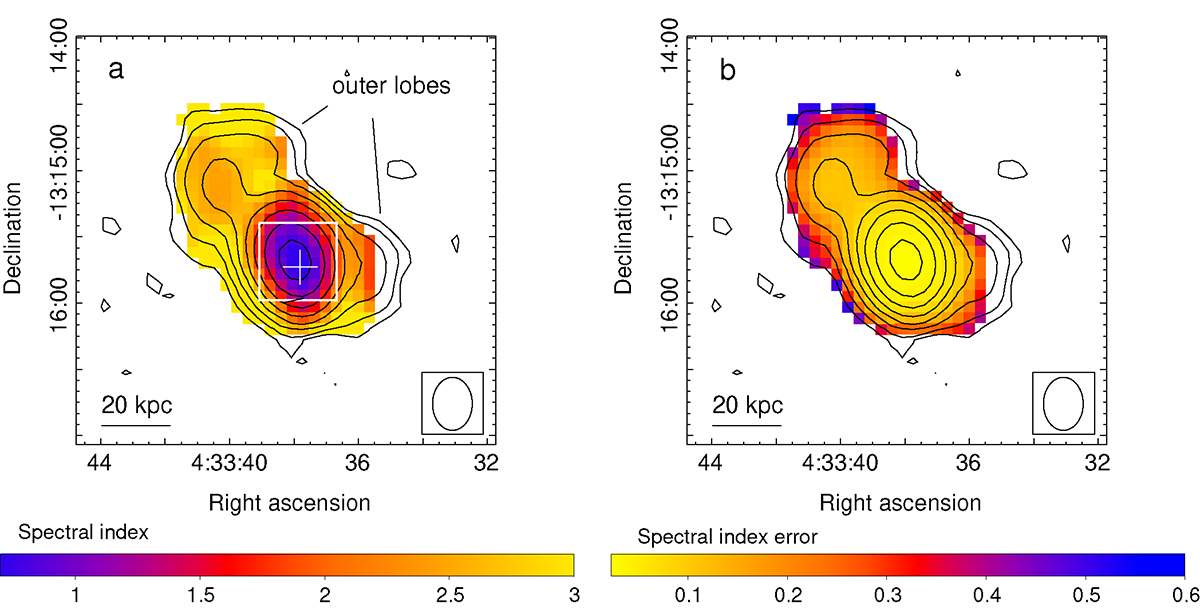
Color-scale image of the spectral index distribution between 150 MHz and 330 MHz (a) and the associated error map (b), computed from primary-beam-corrected images with the same uv range and beam of 24″ × 18″. The spectral index was calculated in each pixel where the surface brightness is above the 3σ level in both images. Overlaid are the 330 MHz contours, spaced by a factor of 2 from 3σ = 3 mJy/beam. The white box marks the region occupied by the inner double source (Fig. 2a). The white cross marks the optical peak (Fig. 1).
Current usage metrics show cumulative count of Article Views (full-text article views including HTML views, PDF and ePub downloads, according to the available data) and Abstracts Views on Vision4Press platform.
Data correspond to usage on the plateform after 2015. The current usage metrics is available 48-96 hours after online publication and is updated daily on week days.
Initial download of the metrics may take a while.