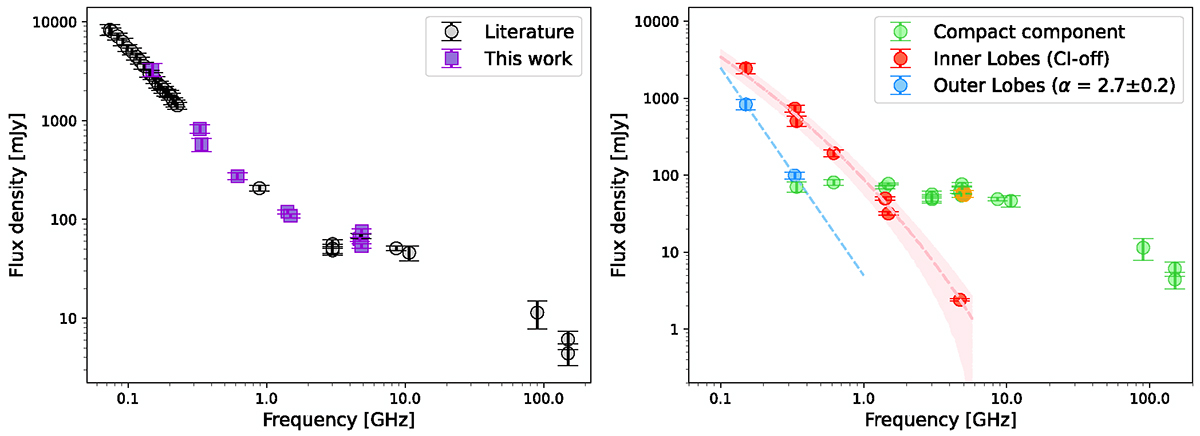
Fig. 4.
Download original image
Spectra of the radio source at the center of A496. Left: integrated radio spectrum of the total radio emission at the center of A496. Our flux density measurements are shown as purple filled squares. Catalog and literature values from Table 4 are shown in black. Right: radio spectra of the individual components. The blue dashed line shows the spectral slope of the outer lobes. The dashed pink line and shaded area represent the best fit and associated uncertainty with a CI-off model to the spectrum of the inner lobes. The VLBA 5 GHz flux density from Ubertosi et al. (2024) is plotted with a gold circle.
Current usage metrics show cumulative count of Article Views (full-text article views including HTML views, PDF and ePub downloads, according to the available data) and Abstracts Views on Vision4Press platform.
Data correspond to usage on the plateform after 2015. The current usage metrics is available 48-96 hours after online publication and is updated daily on week days.
Initial download of the metrics may take a while.