Fig. 10.
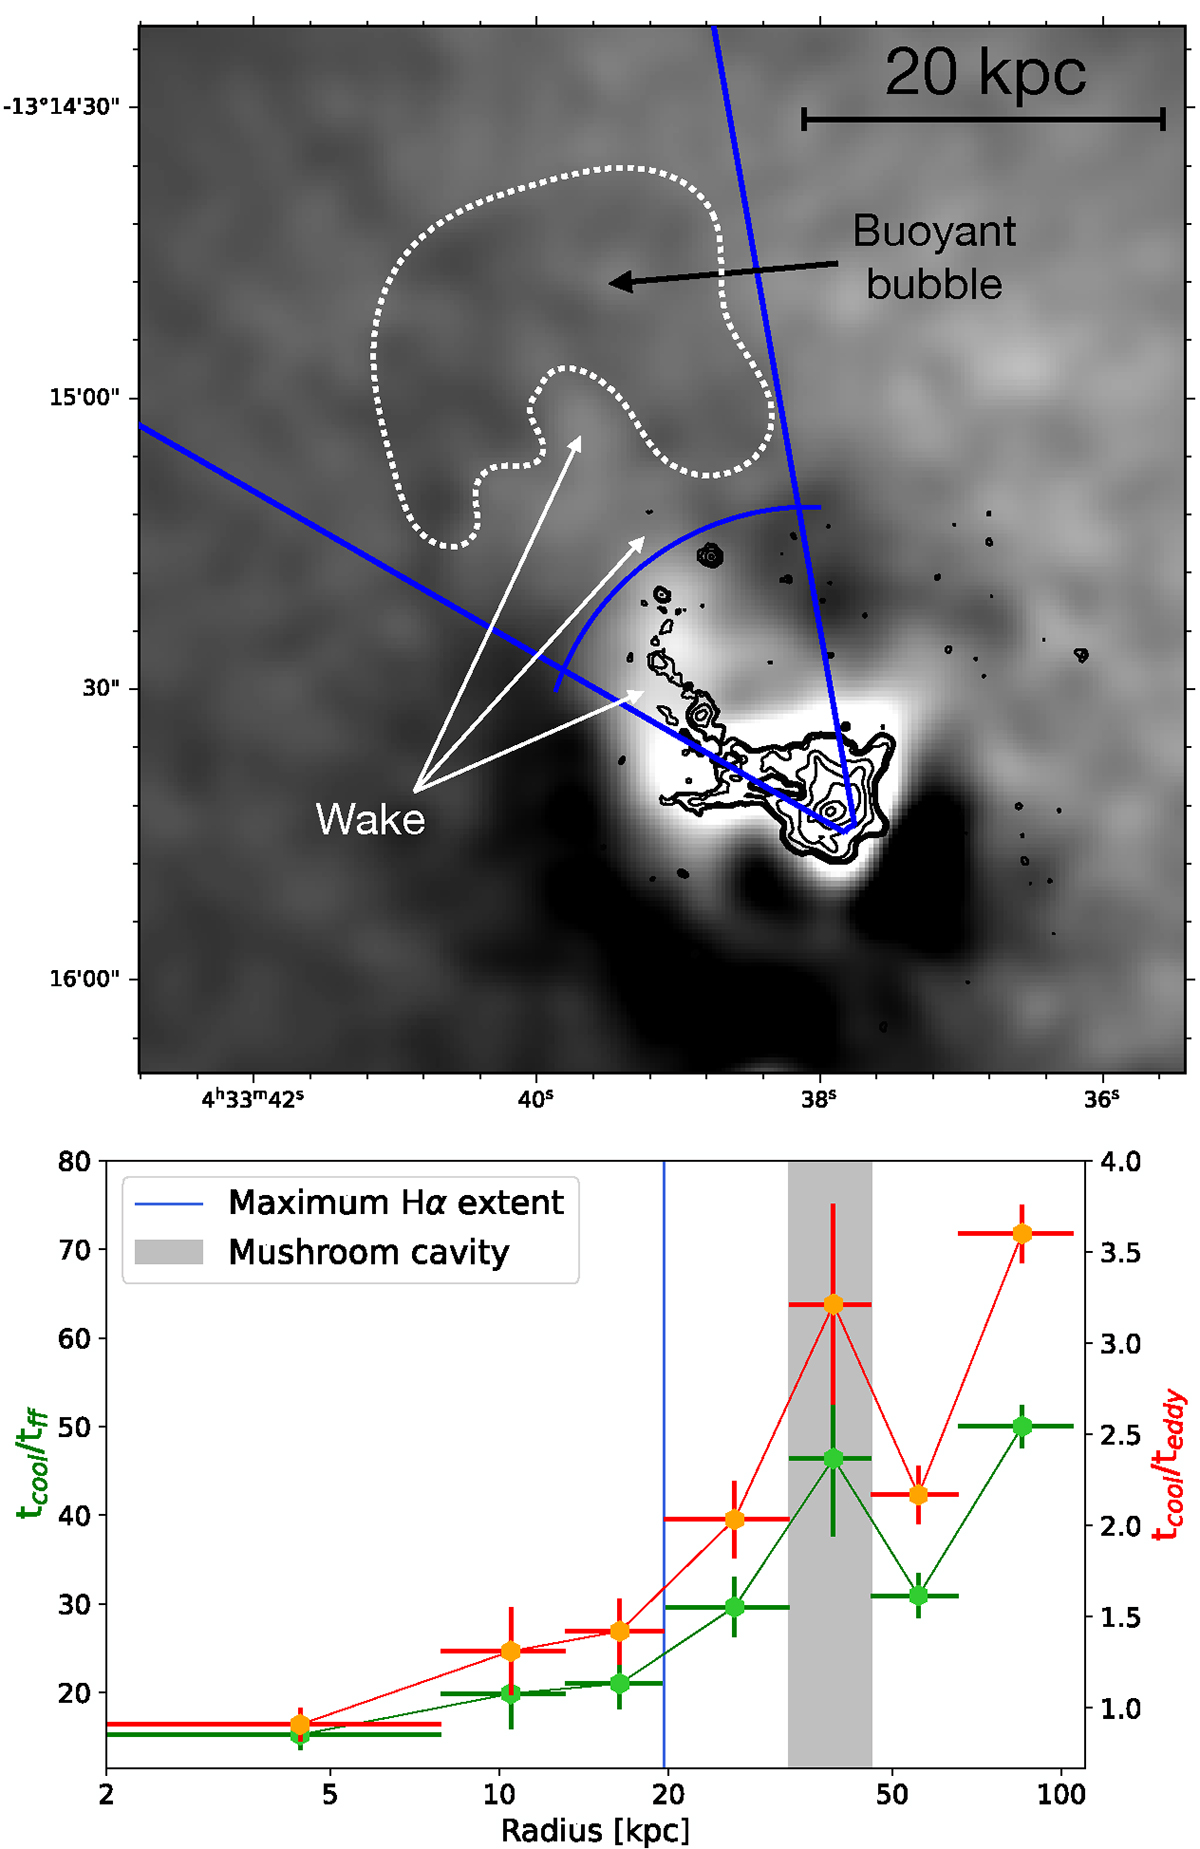
Download original image
ICM cooling in the wake of the mushroom-head-shaped cavity of A496. Top: Chandra unsharp masked image of A496, as shown in Fig. 8. Black contours show the morphology and extent of the warm gas nebula. The position of the wake of entrained gas is highlighted by arrows. The blue lines represent the sector used to extract the radial profiles of cooling instabilities shown in the bottom panel, and the blue arc shows the maximum extent of Hα filaments. The dashed white region shows the mushroom-head-shaped cavity. Bottom: radial profiles of tcool/tff (in green) and tcool/teddy (in orange) across the blue sector shown in the top panel. The blue vertical line marks the maximum extent of the detected Hα filaments, while the gray-shaded area represents the radial extent of the outer X-ray cavity. We note that the profiles in the bottom panel are plotted further out than the extent of the blue sector in the top panel.
Current usage metrics show cumulative count of Article Views (full-text article views including HTML views, PDF and ePub downloads, according to the available data) and Abstracts Views on Vision4Press platform.
Data correspond to usage on the plateform after 2015. The current usage metrics is available 48-96 hours after online publication and is updated daily on week days.
Initial download of the metrics may take a while.