Fig. 9.
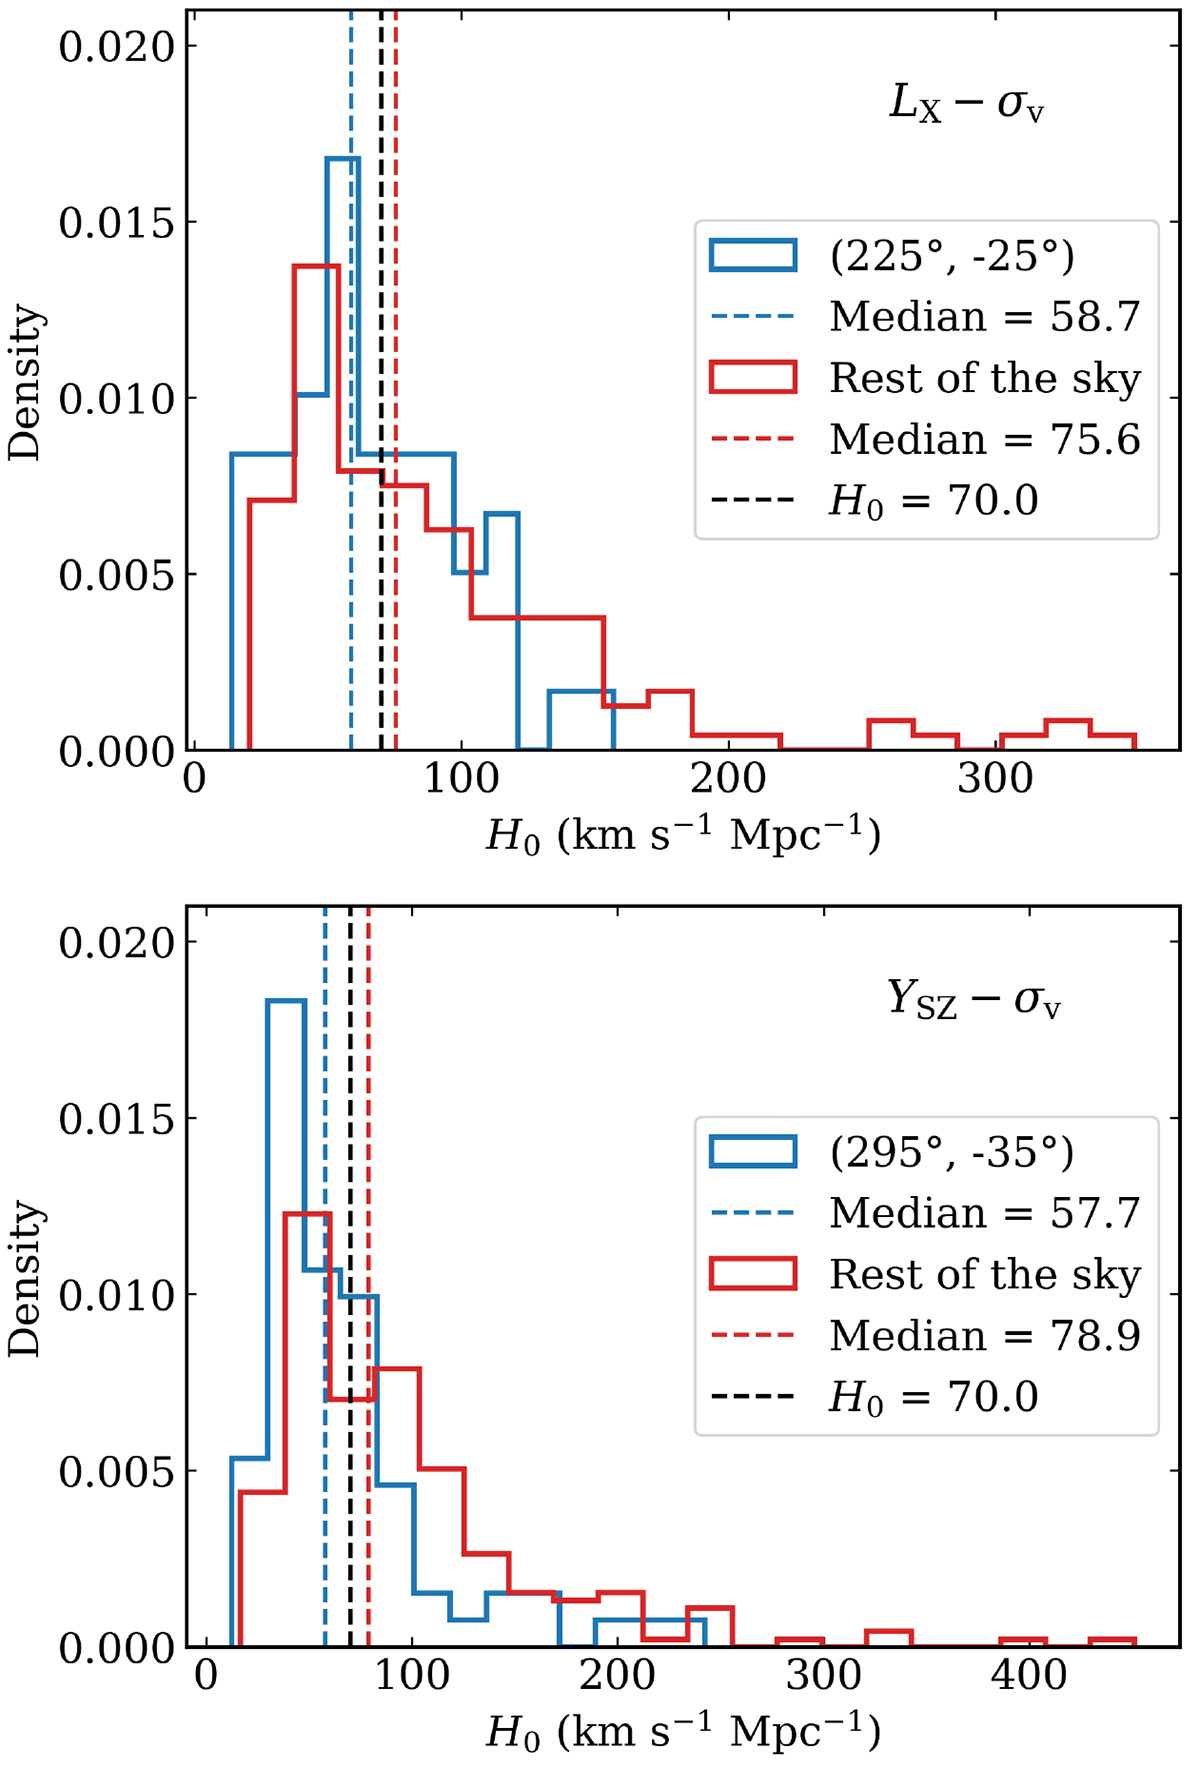
Download original image
Distribution of H0 values corresponding to each data point in the region of maximum anisotropy and rest of the sky for the relations LX − σv (top) and YSZ − σv (bottom). The median of both distributions is shown by dashed lines along with H0 = 70 km s−1 Mpc−1. Note that both regions have different numbers of clusters, and thus, to compare both, the density of the distribution is plotted.
Current usage metrics show cumulative count of Article Views (full-text article views including HTML views, PDF and ePub downloads, according to the available data) and Abstracts Views on Vision4Press platform.
Data correspond to usage on the plateform after 2015. The current usage metrics is available 48-96 hours after online publication and is updated daily on week days.
Initial download of the metrics may take a while.