Fig. 15.
Download original image
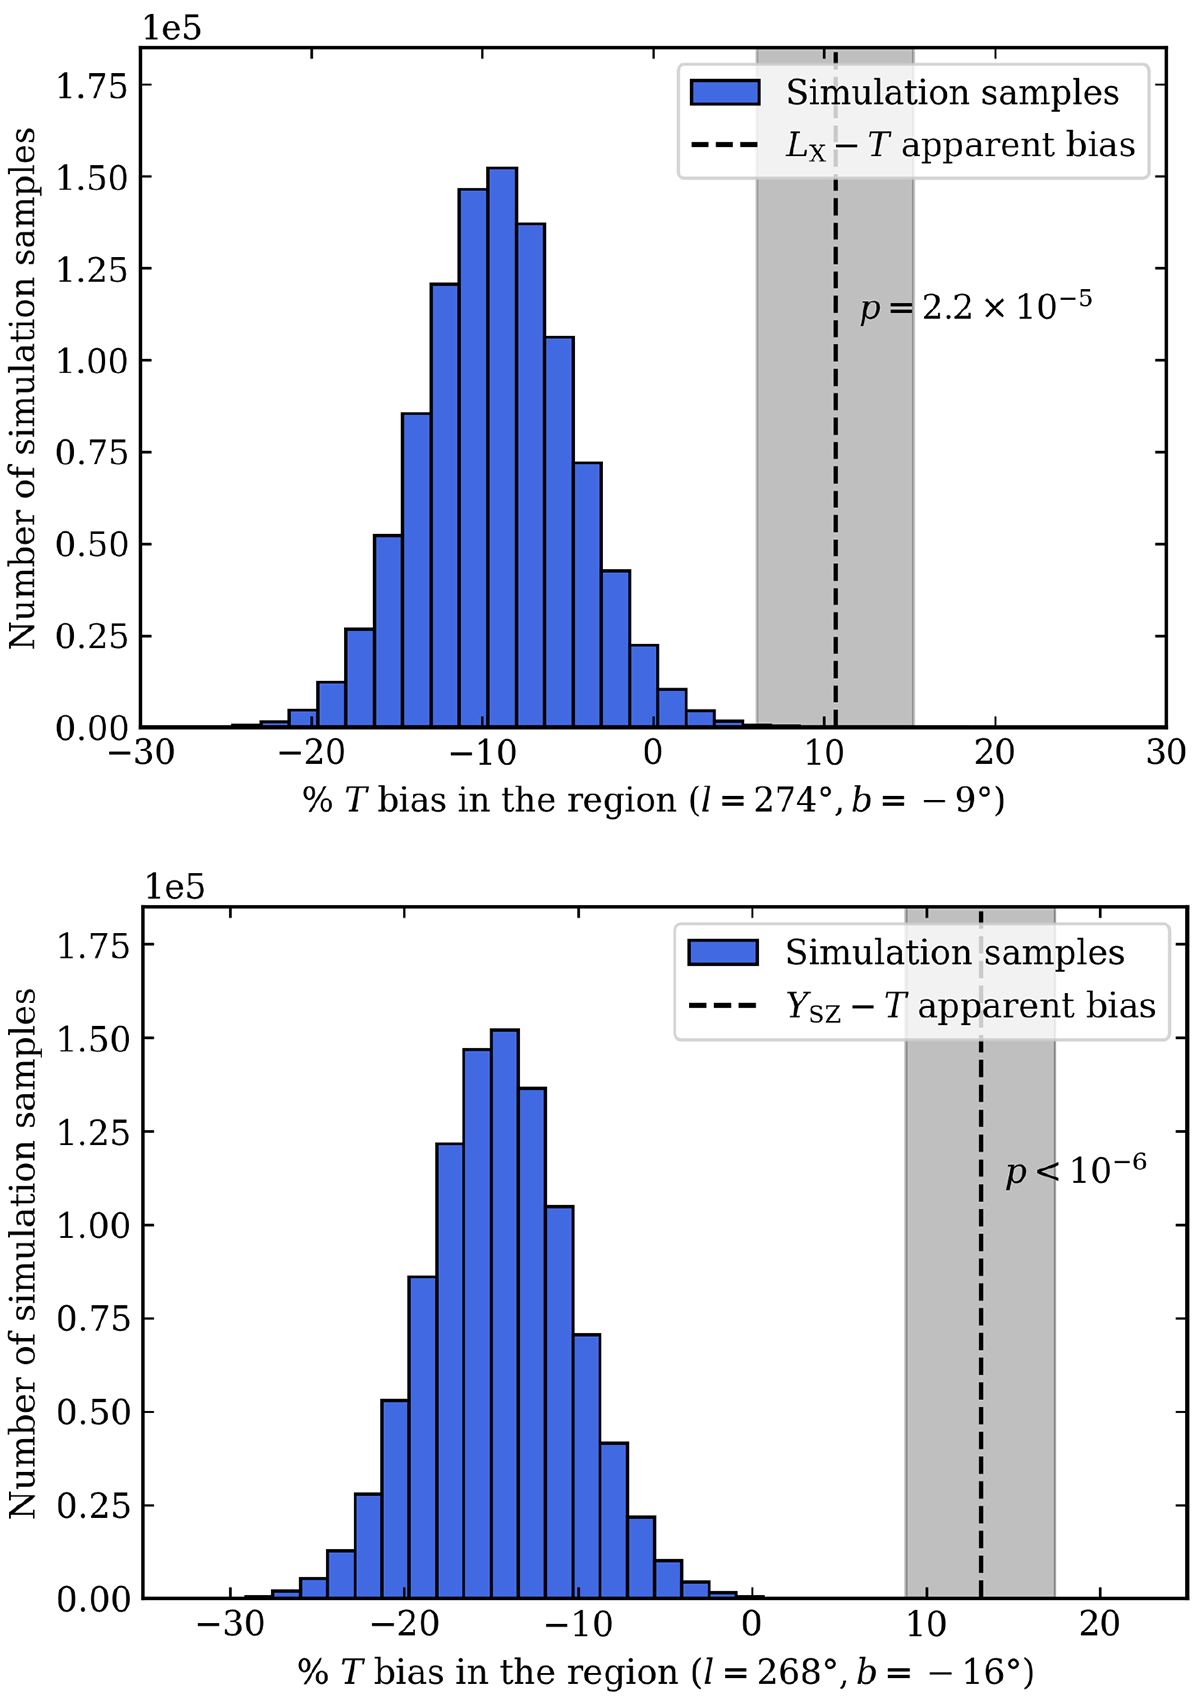
Distribution of T bias in the RLT (top) and RYT (bottom) regions for one million simulated samples. The vertical black dashed line indicates the T bias needed to account for the results of M21 (ΔTLT and ΔTYT), and the shaded region represents its 1σ uncertainties. The p-value displayed next to it shows the probability of obtaining samples with a higher T bias than ΔTLT and ΔTYT, respectively.
Current usage metrics show cumulative count of Article Views (full-text article views including HTML views, PDF and ePub downloads, according to the available data) and Abstracts Views on Vision4Press platform.
Data correspond to usage on the plateform after 2015. The current usage metrics is available 48-96 hours after online publication and is updated daily on week days.
Initial download of the metrics may take a while.