Open Access
Fig. 13.
Download original image
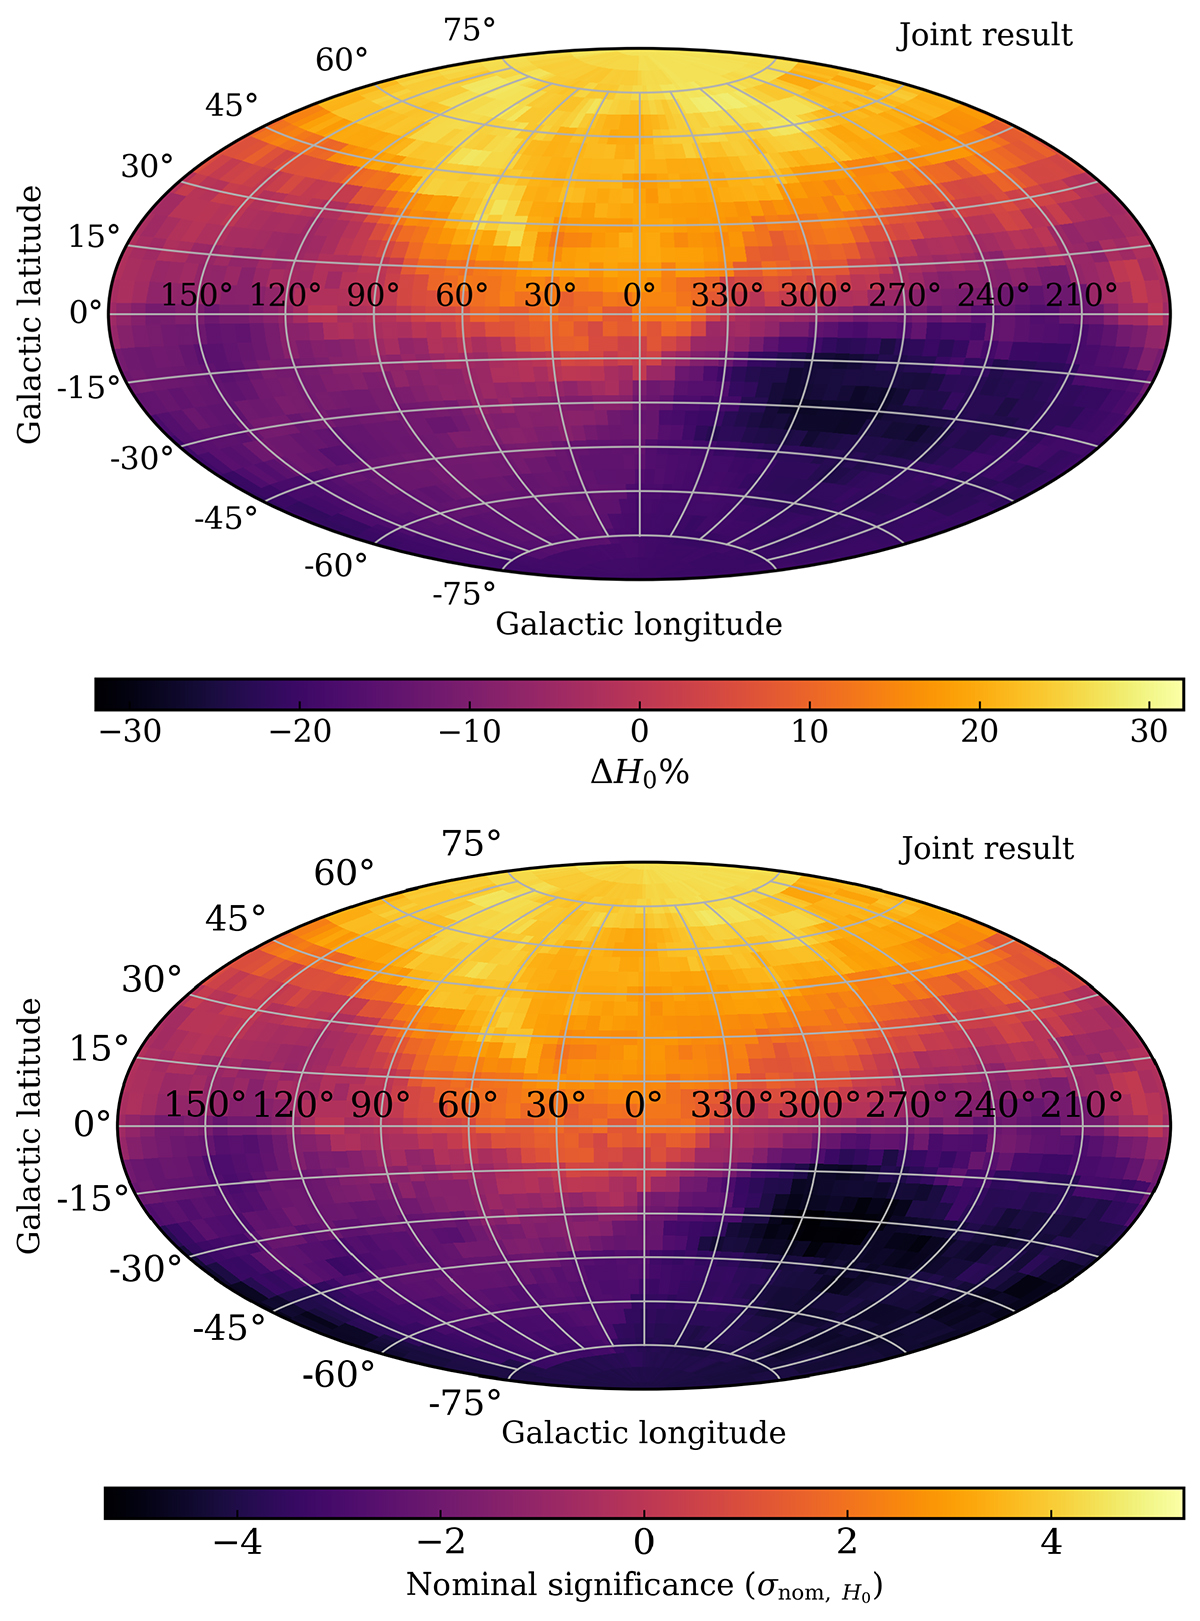
H0 angular variation maps created from the joint analysis of relations LX − σv and YSZ − σv (top) and its nominal significance map (bottom). Colour scales for the H0 angular variation map are the same as before, but the colour scales for the sigma map have been increased to account for increased significance.
Current usage metrics show cumulative count of Article Views (full-text article views including HTML views, PDF and ePub downloads, according to the available data) and Abstracts Views on Vision4Press platform.
Data correspond to usage on the plateform after 2015. The current usage metrics is available 48-96 hours after online publication and is updated daily on week days.
Initial download of the metrics may take a while.