Fig. 6
Download original image
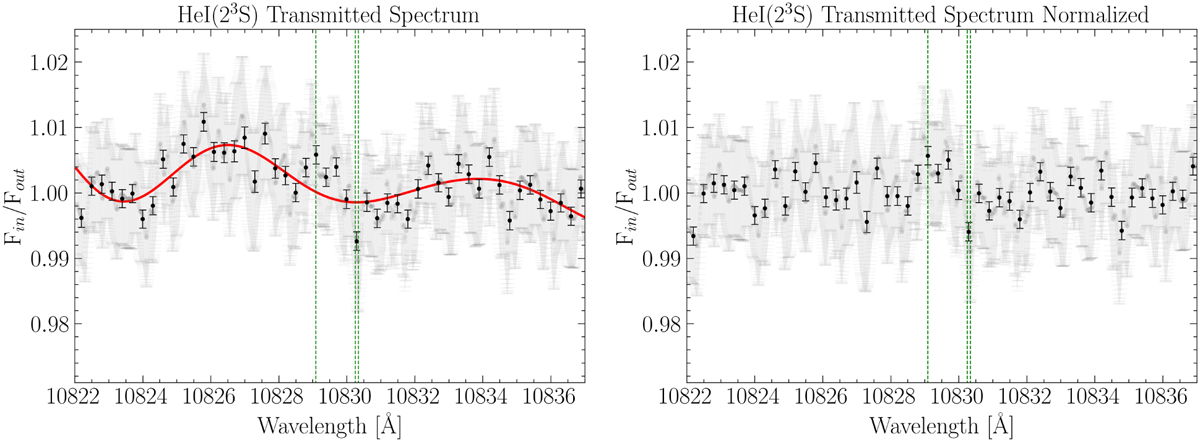
He I(23S) transmission spectrum. Left panel: in gray Fin/Fout obtained with the transmission spectroscopy analysis. A sinusoidal shape is evident. The red line is the sinusoidal fit obtained using the relation described in the text. Right panel: gray transmission spectrum divided by the sinusoidal red fit. Black dots represent the binned spectra with equally spaced bins of 0.3 Å, while vertical dashed green lines show the positions of the theoretical He I(23 S) lines in vacuum.
Current usage metrics show cumulative count of Article Views (full-text article views including HTML views, PDF and ePub downloads, according to the available data) and Abstracts Views on Vision4Press platform.
Data correspond to usage on the plateform after 2015. The current usage metrics is available 48-96 hours after online publication and is updated daily on week days.
Initial download of the metrics may take a while.