Open Access
Fig. 5
Download original image
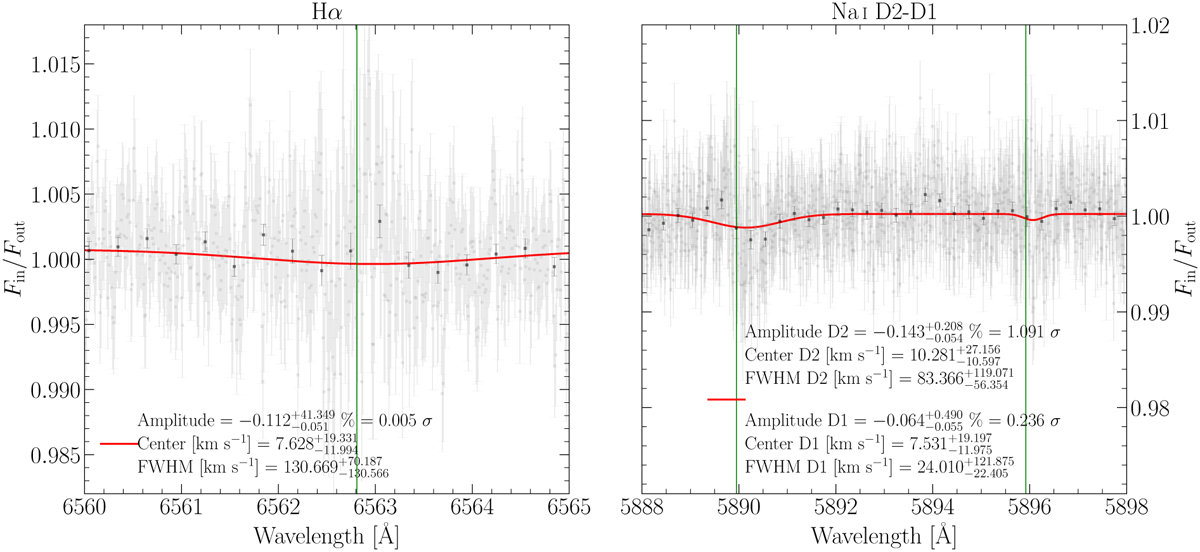
Hα and Na I D2-D1 transmission spectra. The gray points are our transmission spectra, the red line the best Gaussian fit, and the black dots are the result of resampling the transmission spectra with a bin size of 0.3 A.
Current usage metrics show cumulative count of Article Views (full-text article views including HTML views, PDF and ePub downloads, according to the available data) and Abstracts Views on Vision4Press platform.
Data correspond to usage on the plateform after 2015. The current usage metrics is available 48-96 hours after online publication and is updated daily on week days.
Initial download of the metrics may take a while.