Open Access
Fig. 4
Download original image
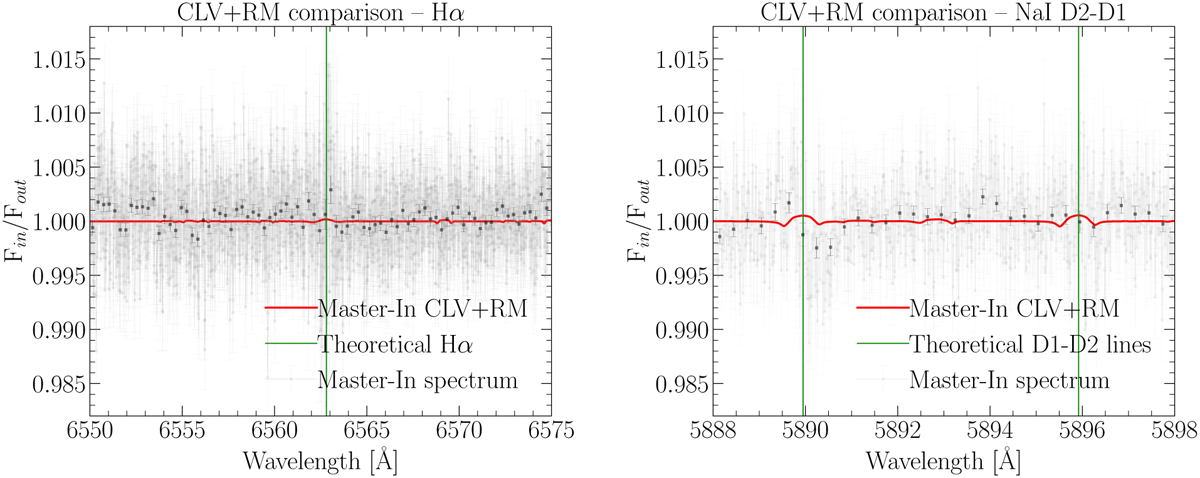
CLV+RM models (red) compared with transmission spectra (light gray) around the Hα and Na I D doublet wavelength regions. Green lines show the position of the theoretical values of Hα, Na I D2, and D1 lines. The CLV+RML model contamination is well within the data noise.
Current usage metrics show cumulative count of Article Views (full-text article views including HTML views, PDF and ePub downloads, according to the available data) and Abstracts Views on Vision4Press platform.
Data correspond to usage on the plateform after 2015. The current usage metrics is available 48-96 hours after online publication and is updated daily on week days.
Initial download of the metrics may take a while.