Open Access
Fig. 2
Download original image
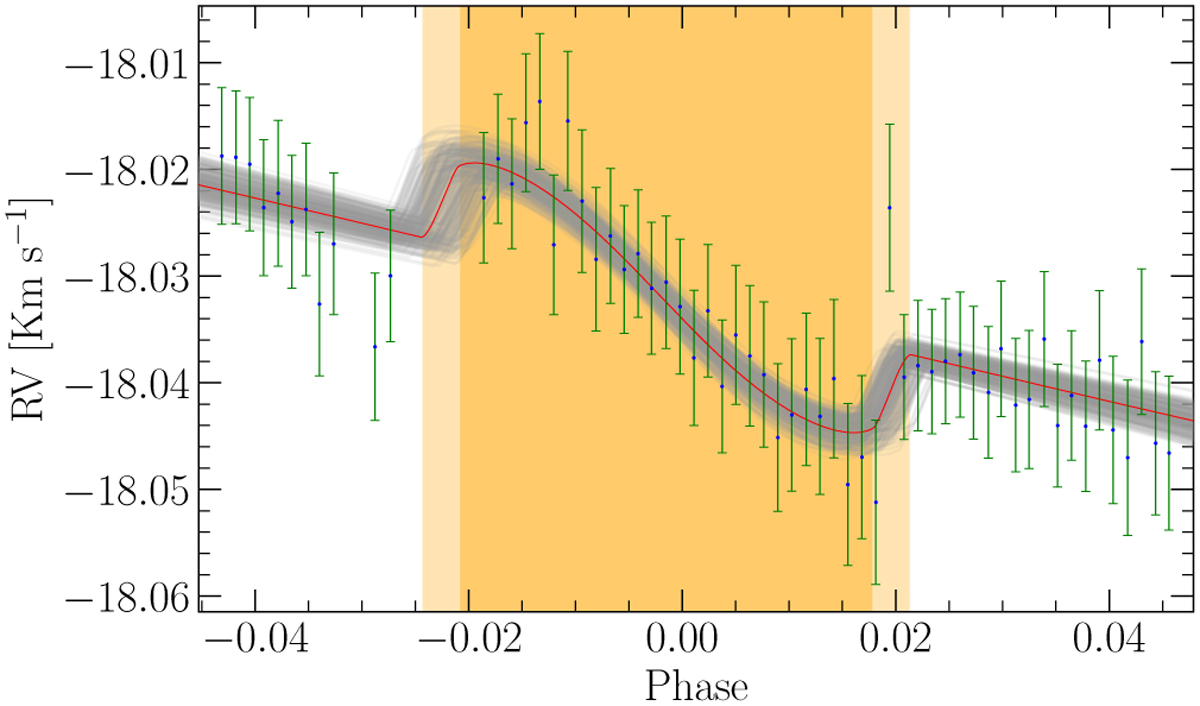
Result from the RML fitting procedure performed with CaRM. The red line is the best-fit model, and the gray shadows are a random sample of the posterior distribution. The yellow regions show the ingress and egress of the transit, while the orange region shows where the planet is fully transiting the stellar disk.
Current usage metrics show cumulative count of Article Views (full-text article views including HTML views, PDF and ePub downloads, according to the available data) and Abstracts Views on Vision4Press platform.
Data correspond to usage on the plateform after 2015. The current usage metrics is available 48-96 hours after online publication and is updated daily on week days.
Initial download of the metrics may take a while.