Open Access
Fig. 1
Download original image
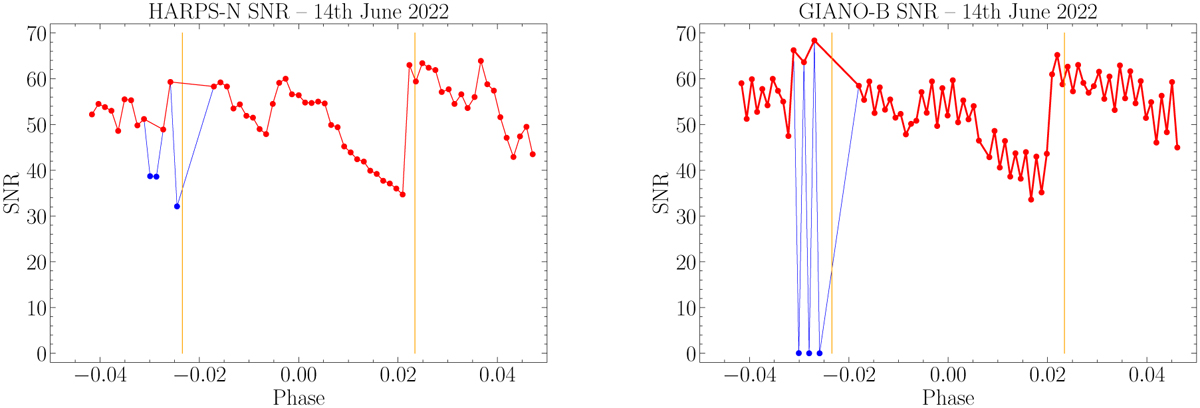
HARPS-N and GIANO-B S/N for the second night evaluated at 5500 and 16 300 Å, respectively. The red dots represent the S/N of the spectra used for transmission spectroscopy analysis, while the blue ones are discarded. The two vertical orange lines denote the T1 and T4 transit contact points.
Current usage metrics show cumulative count of Article Views (full-text article views including HTML views, PDF and ePub downloads, according to the available data) and Abstracts Views on Vision4Press platform.
Data correspond to usage on the plateform after 2015. The current usage metrics is available 48-96 hours after online publication and is updated daily on week days.
Initial download of the metrics may take a while.