Fig. 7
Download original image
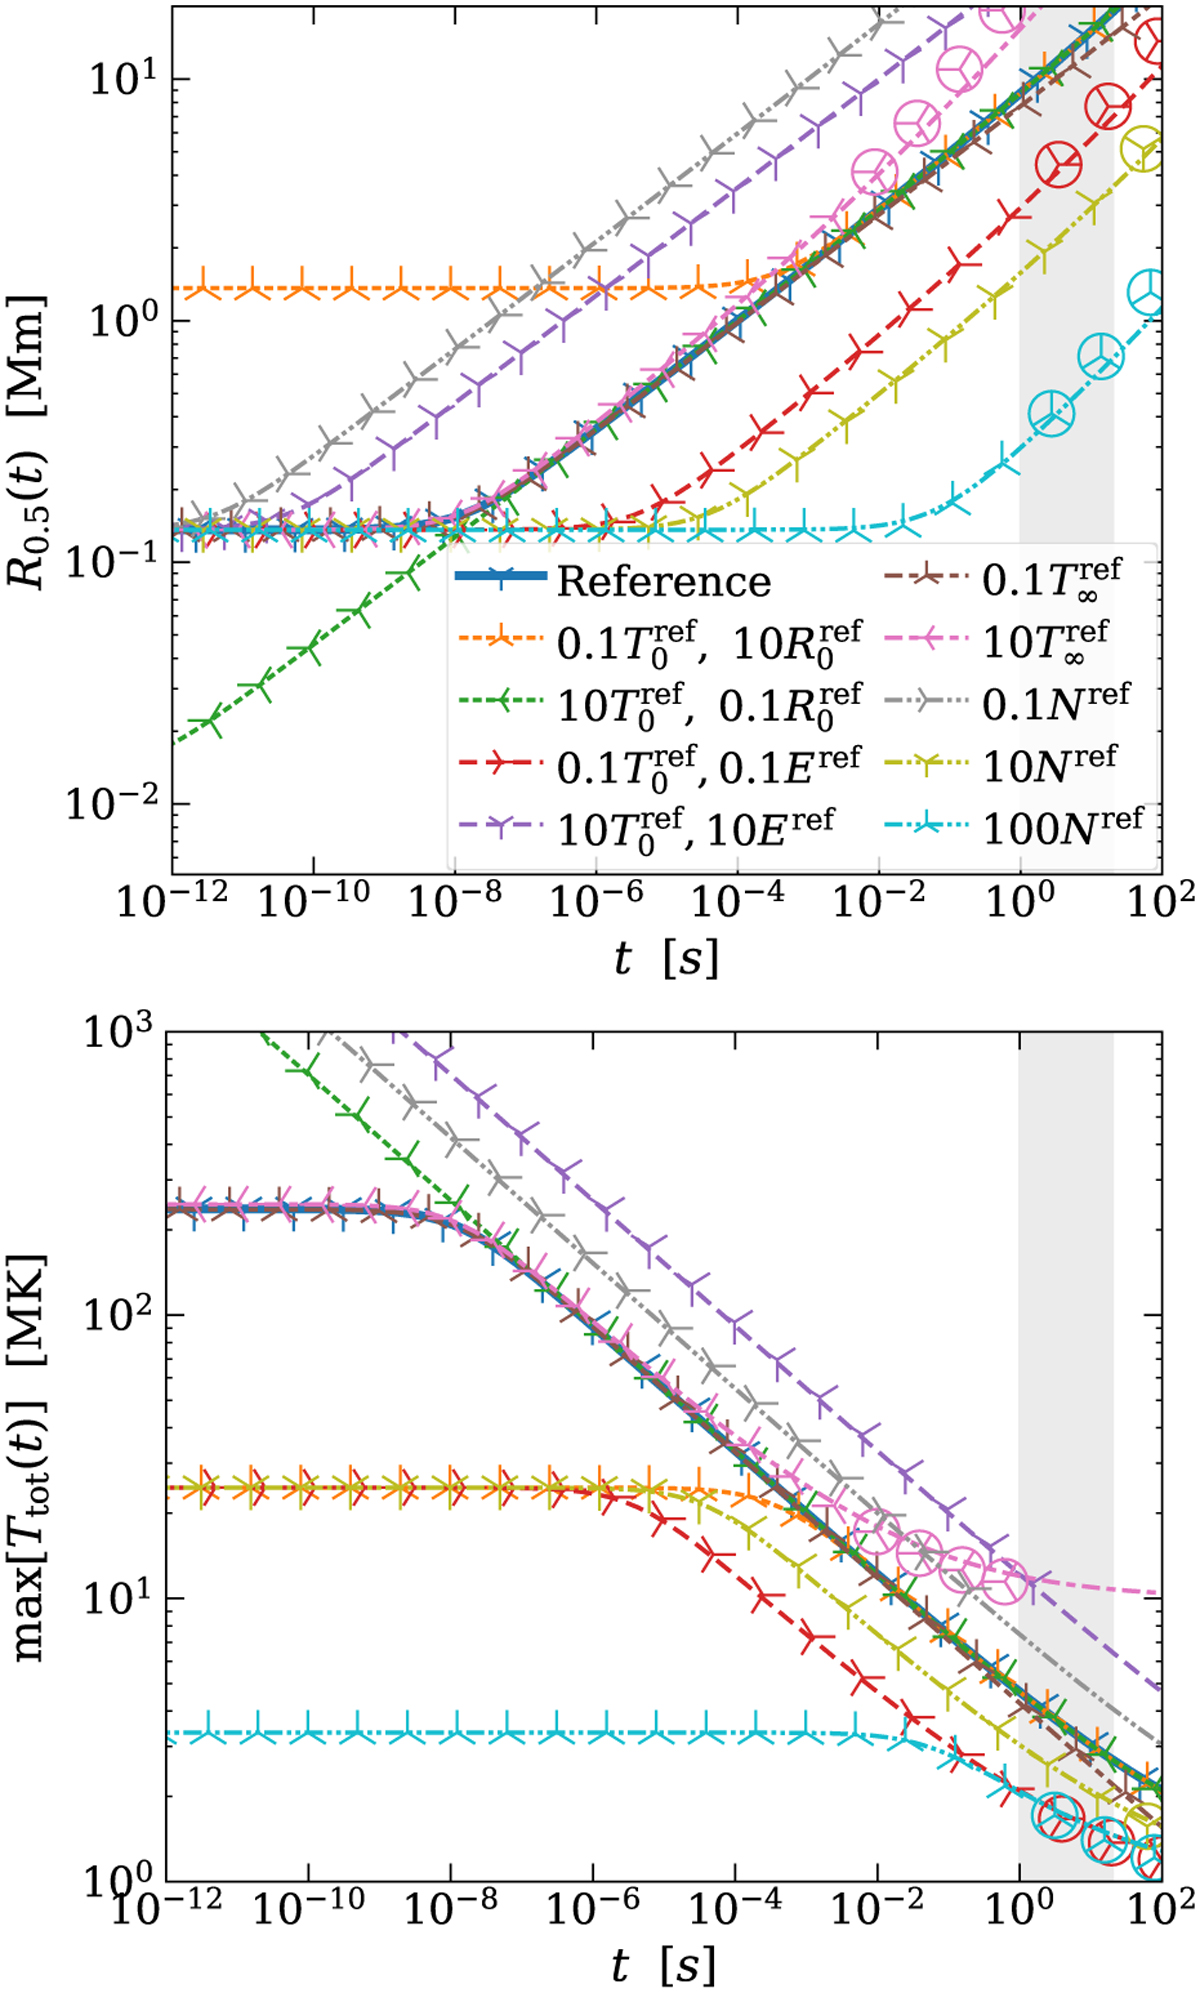
Evolution of the width and maximum of the temperature peak after the concentrated release of energy corresponding to 1 s of a nanoflare in the solar corona. The model parameters are detailed in Sect. 5.1. The top panel shows the HWHM, while the bottom panel shows maximum temperature. The curves were calculated with Eqs. (22)–(23) and the points were calculated with simulations. Where the points are encircled ϕ∞ ≥ ϕ0, making the equations a poor approximation. The gray shaded area corresponds to t ∊ [1 s, 20 s], the time frame of interest of the simulations in Polito et al. (2018).
Current usage metrics show cumulative count of Article Views (full-text article views including HTML views, PDF and ePub downloads, according to the available data) and Abstracts Views on Vision4Press platform.
Data correspond to usage on the plateform after 2015. The current usage metrics is available 48-96 hours after online publication and is updated daily on week days.
Initial download of the metrics may take a while.