Fig. 4
Download original image
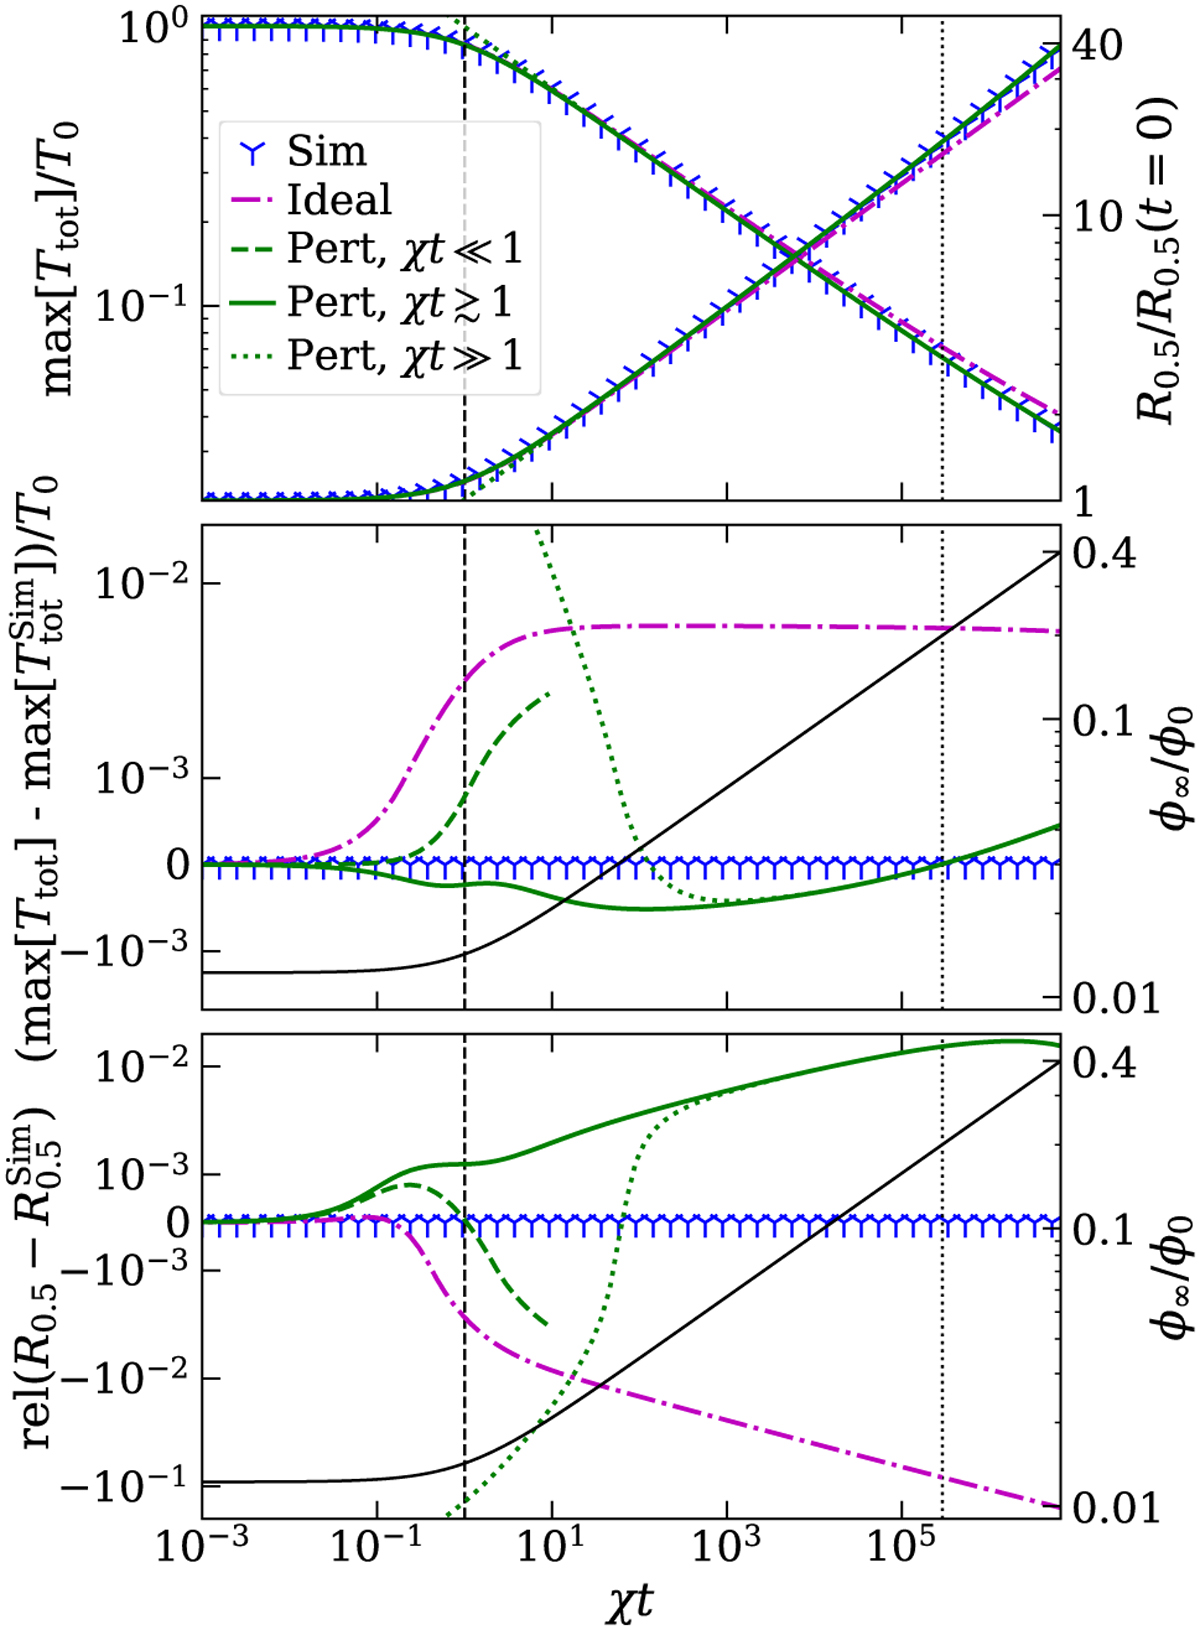
Verification of analytical derivation for T∞/T0 = 0.01. Comparison as a function of χt for a simulation in Python (blue markers), as well as the zeroth-order (magenta curve) and first-order solutions (three green curves). In the top panel, the absolute reduction of max[TTot] and widening of HWHM (R0.5) is shown. In the following two panels, the difference to the simulation is shown for the peak temperature and width, respectively. These panels also include the evolution of ϕ∞/ϕ0 in black. The dashed vertical line marks t = 1/χ and the dotted vertical line marks t = t’ >> 1/χ, the time of the snapshot in Fig. 3b.
Current usage metrics show cumulative count of Article Views (full-text article views including HTML views, PDF and ePub downloads, according to the available data) and Abstracts Views on Vision4Press platform.
Data correspond to usage on the plateform after 2015. The current usage metrics is available 48-96 hours after online publication and is updated daily on week days.
Initial download of the metrics may take a while.