Fig. 3
Download original image
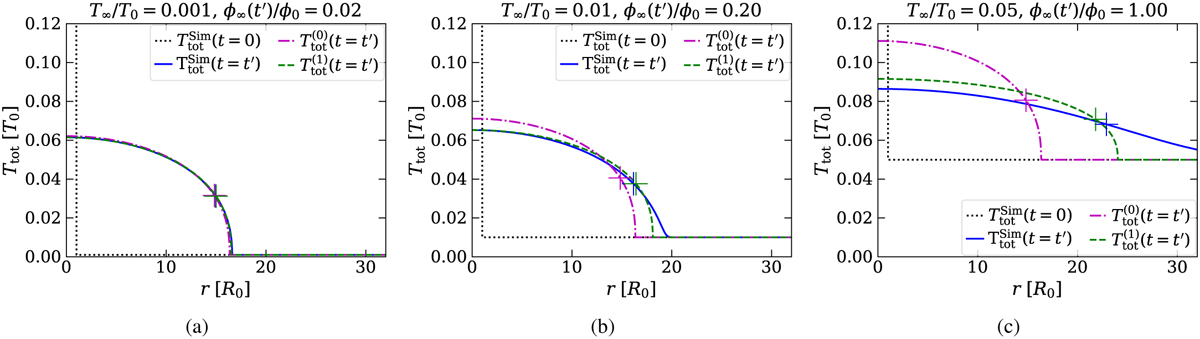
Verification of analytical derivation. Each plot shows the IC, as well as the simulation run using solve_ivp in Python, zeroth-order solution T(0), and first-order solution T(1), all at a later time such that χt >> 1. The colored ‘+’ corresponds to the HWHM point of each calculation. This is done for increasing background values T∞/T0 given by the plot titles. The simulation box extends to r = 100 R0 in (c), preventing any impacts caused by the boundary condition.
Current usage metrics show cumulative count of Article Views (full-text article views including HTML views, PDF and ePub downloads, according to the available data) and Abstracts Views on Vision4Press platform.
Data correspond to usage on the plateform after 2015. The current usage metrics is available 48-96 hours after online publication and is updated daily on week days.
Initial download of the metrics may take a while.