Open Access
Fig. 9
Download original image
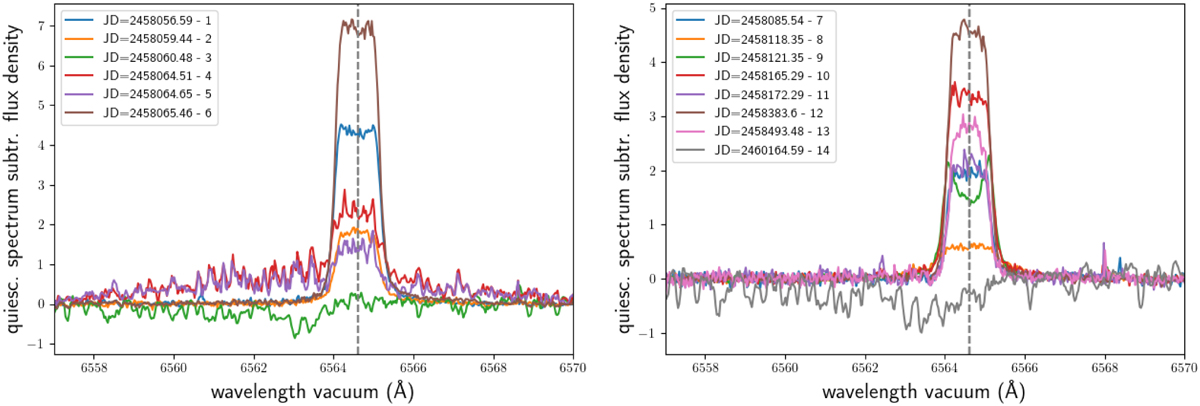
Flare spectra and spectra with an unusual line shape with a mean quiescent spectrum subtracted. In the legend the spectra are ordered by occurrence time, and additionally the label from Fig. 1 is given. The spectra are split into two panels for clarity.
Current usage metrics show cumulative count of Article Views (full-text article views including HTML views, PDF and ePub downloads, according to the available data) and Abstracts Views on Vision4Press platform.
Data correspond to usage on the plateform after 2015. The current usage metrics is available 48-96 hours after online publication and is updated daily on week days.
Initial download of the metrics may take a while.