Fig. 8
Download original image
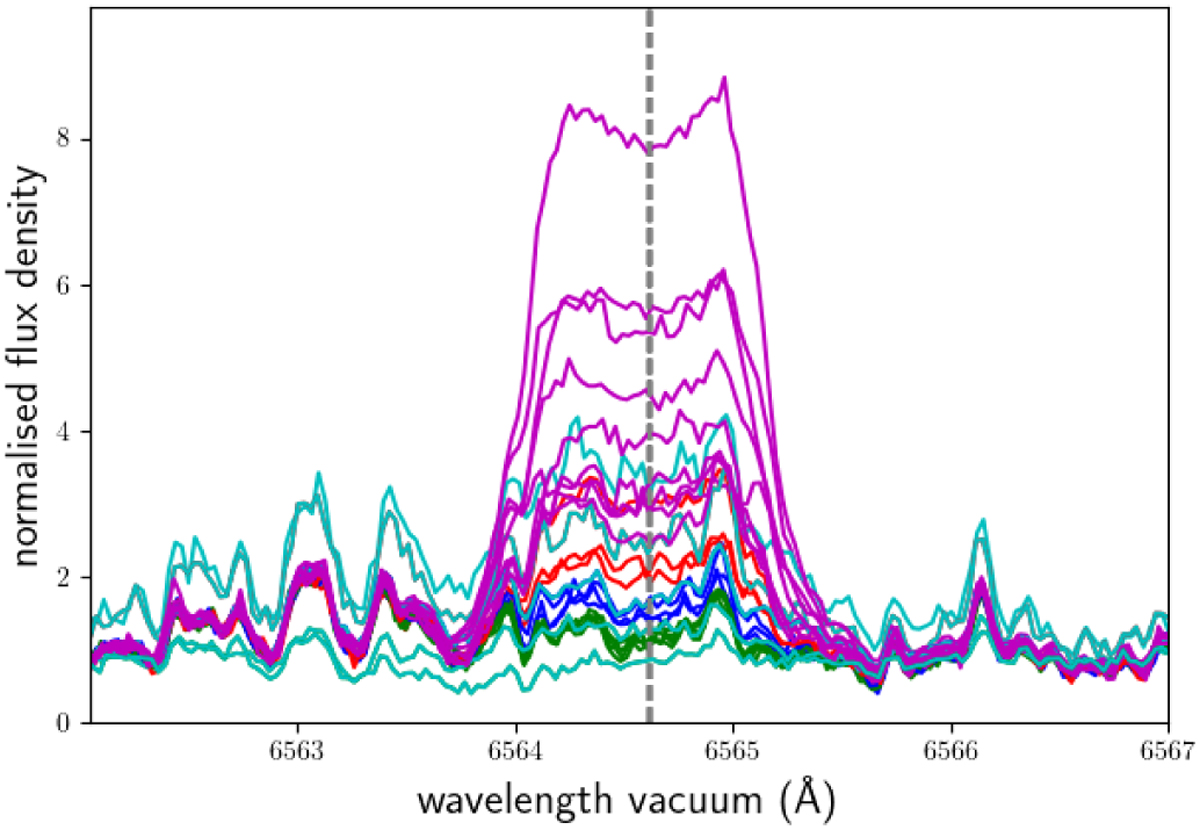
Selected spectra of Teegarden’s star around the Hα line to demonstrate the line shape during quiescent phases and all flares. The spectra of activity level (1) are shown in green, of activity level (2) in blue, and of activity level (3) in red. The flare spectra are shown in magenta. There are a few spectra showing peculiar line shapes with broad additional line components either in absorption or emission (cyan lines). The dashed vertical line marks the central wavelength of Hα. The normalisation wavelength intervals are located well outside any broad wings at 6537.4–6547.9 and 6577.9–6586.4 Å. For the shown spectra the statistical errors are insignificant.
Current usage metrics show cumulative count of Article Views (full-text article views including HTML views, PDF and ePub downloads, according to the available data) and Abstracts Views on Vision4Press platform.
Data correspond to usage on the plateform after 2015. The current usage metrics is available 48-96 hours after online publication and is updated daily on week days.
Initial download of the metrics may take a while.