Open Access
Fig. A.3
Download original image
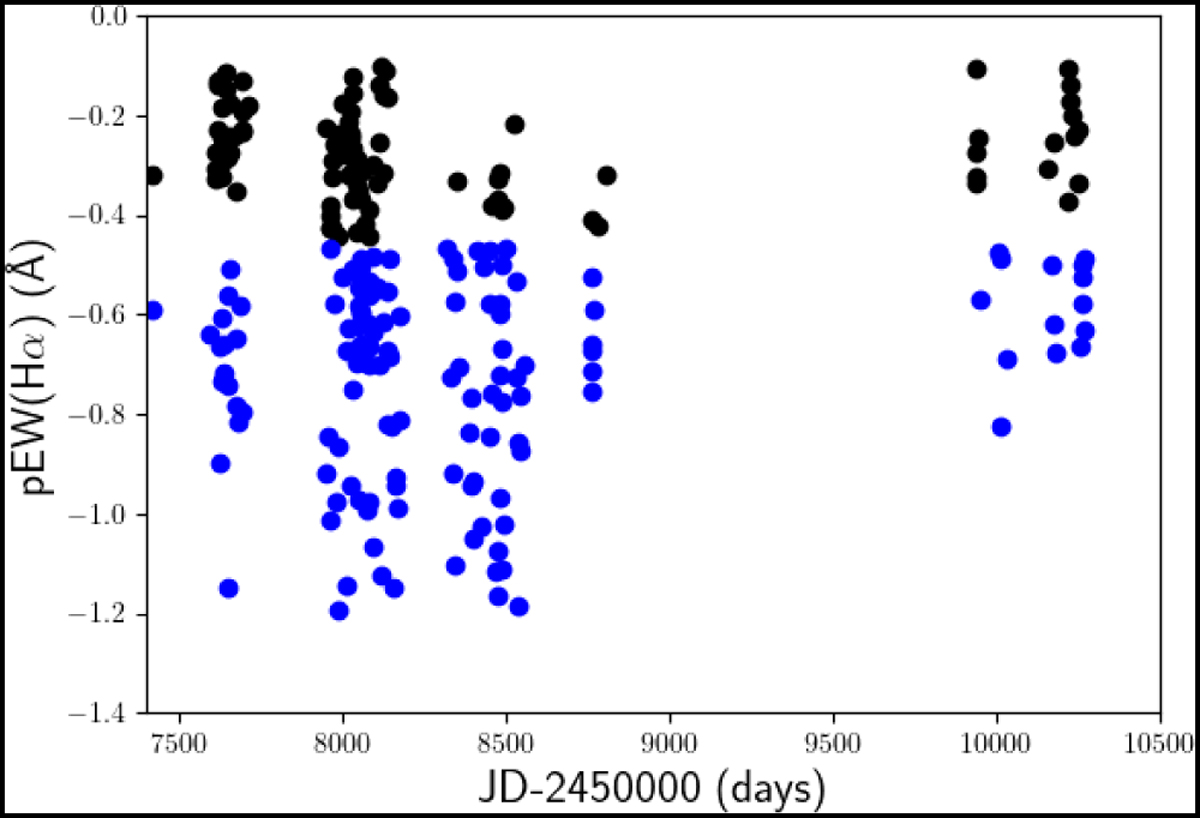
Time series of pEW(Hα) as in Fig. 1. We mark low activity states as black and blue dots, higher activity states as red dots, and spectra with an uncommon Hα shape with cyan dots. The upper envelope of the black dots show first an increase, then a decrease and again high pEW(Hα) values for the last data points.
Current usage metrics show cumulative count of Article Views (full-text article views including HTML views, PDF and ePub downloads, according to the available data) and Abstracts Views on Vision4Press platform.
Data correspond to usage on the plateform after 2015. The current usage metrics is available 48-96 hours after online publication and is updated daily on week days.
Initial download of the metrics may take a while.