Fig. 1
Download original image
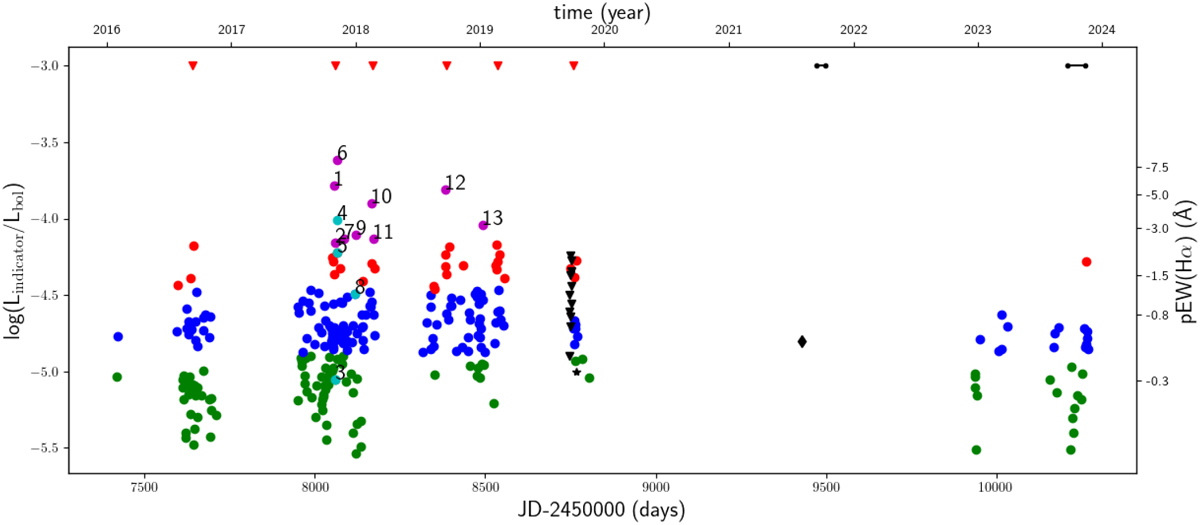
Time series of Lindicator/Lbol- For the CARMENES LHα/Lbol we mark low activity states as green and blue dots, high activity states as red dots, flares as magenta dots, and spectra with an asymmetric Hα shape as cyan dots (see Sect. 6.1 for a detailed discussion). The cyan and magenta dots are labelled with the flare number also used in Fig. 9. Flare no. 14 is not shown here since the spectrum gets into absorption, and therefore no LHα/Lbol can be calculated with the χ method used here since it is only defined for emission lines. The ESPRESSO Hα measurements are marked as black triangles. The LX/Lbol measurement of the Chandra observation is marked as a black star; that of the XMM-Newton observation is marked as a black diamond. The time spans of the TESS observations are marked as small black dots connected by a black line. Since TESS is not photometrically calibrated, the position on the y-axis is arbitrary (we note here that for a blackbody of the temperature of Teegarden’s star about 20% of the radiation is in the TESS band). The red triangles mark the positions of the clusters of the higher activity states.
Current usage metrics show cumulative count of Article Views (full-text article views including HTML views, PDF and ePub downloads, according to the available data) and Abstracts Views on Vision4Press platform.
Data correspond to usage on the plateform after 2015. The current usage metrics is available 48-96 hours after online publication and is updated daily on week days.
Initial download of the metrics may take a while.