Fig. 15.
Download original image
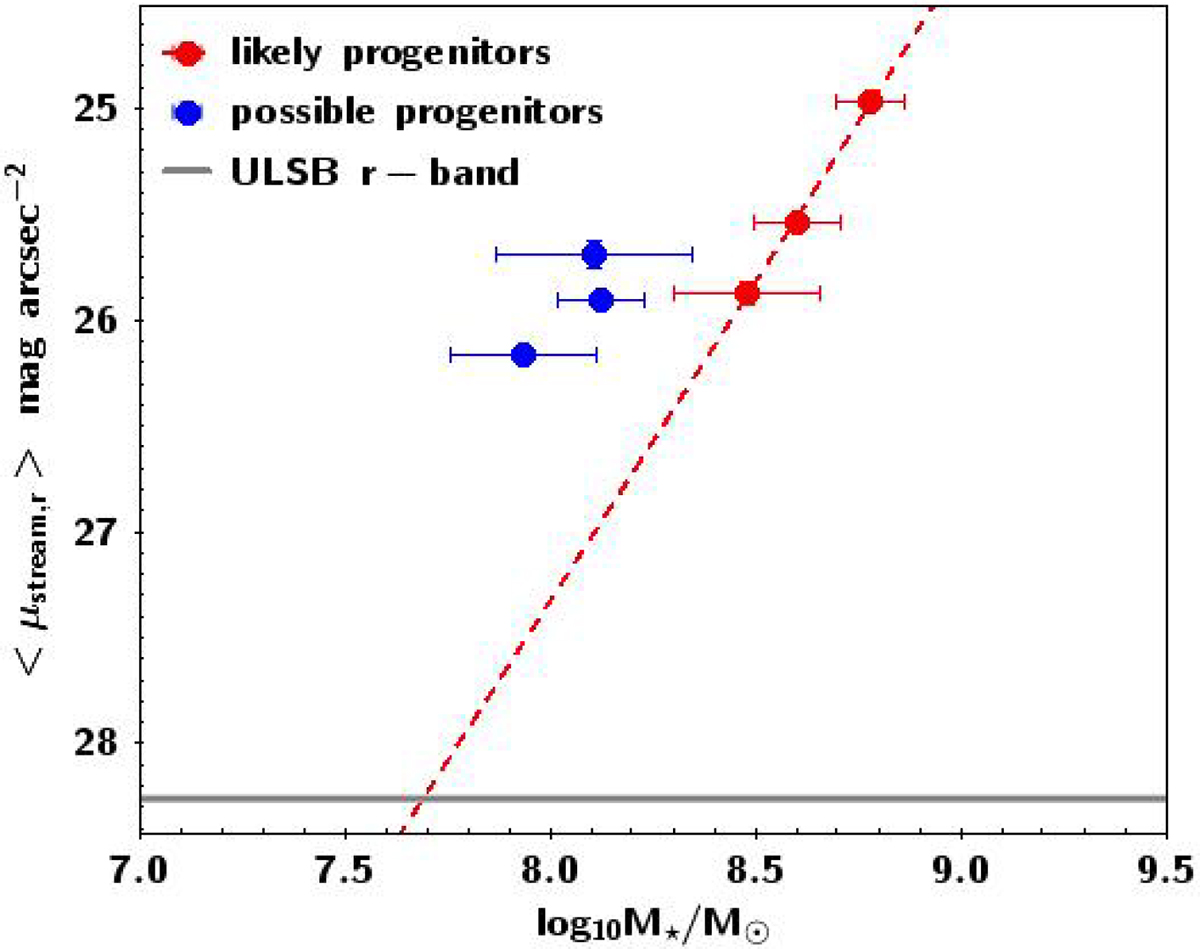
Stream average surface brightness versus progenitor log10M⋆/M⊙). Red dots are the progenitors confirmed with high likelihood; blue dots indicate the possible progenitors that cannot be confirmed with high likelihood. The dashed line is the linear fit of the progenitors confirmed with high likelihood. The horizontal grey line indicates the average ULSB for the r band.
Current usage metrics show cumulative count of Article Views (full-text article views including HTML views, PDF and ePub downloads, according to the available data) and Abstracts Views on Vision4Press platform.
Data correspond to usage on the plateform after 2015. The current usage metrics is available 48-96 hours after online publication and is updated daily on week days.
Initial download of the metrics may take a while.