Fig. 8
Download original image
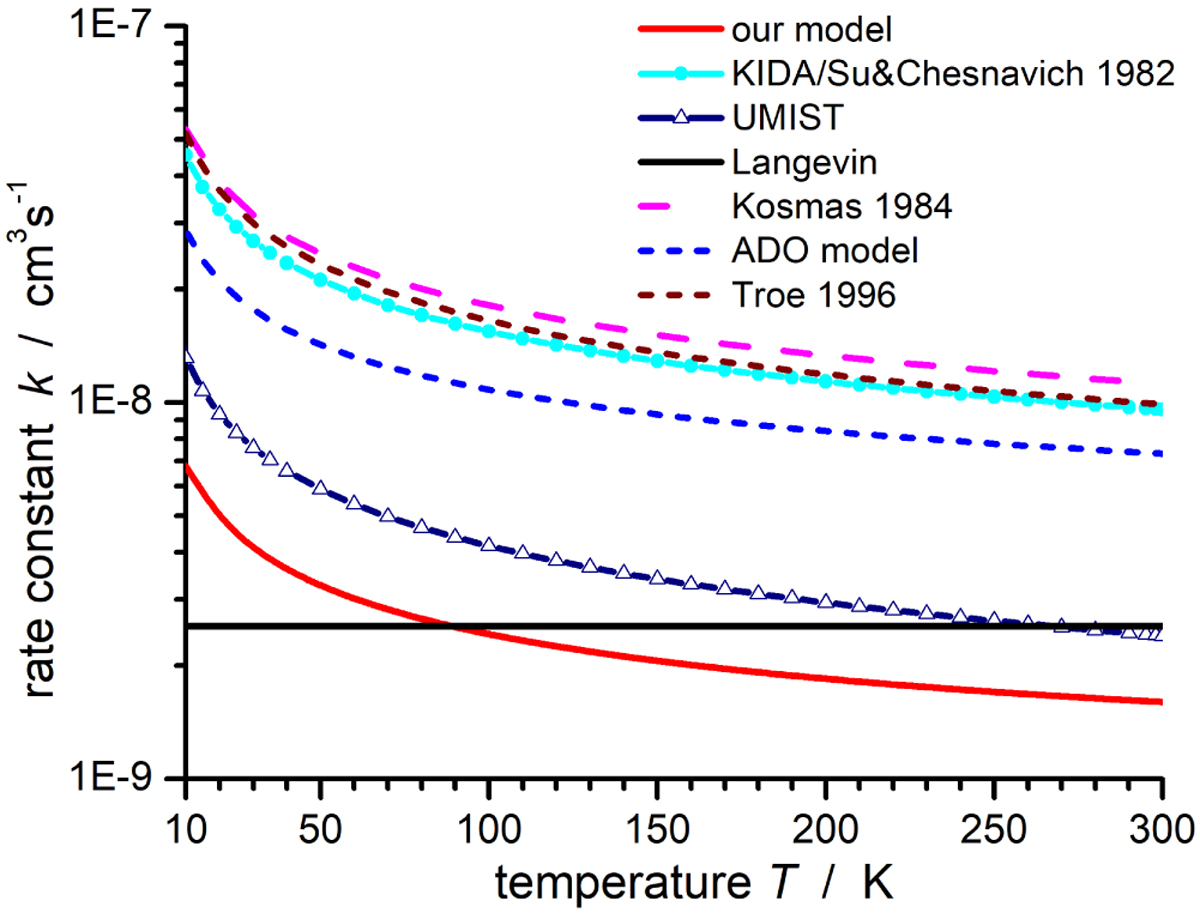
Total rate constants k as a function of temperature T for the reaction of He+⋅ with CH3CN. Solid red line: our model, solid black line: Langevin model, cyan line with dots: KIDA database (Wakelam et al. 2015; Su & Chesnavich 1982), blue line with triangles: UMIST database (Millar et al. 2024), dashed blue line: scaled averaged dipole orientation (ADO) with ![]() (Bass et al. 1975; Su et al. 1978), dashed magenta line: average cosθ method (Kosmas 1984), dashed brown line: statistical adiabatic channel model (SACM), Eq. (5.2) from Troe (1996).
(Bass et al. 1975; Su et al. 1978), dashed magenta line: average cosθ method (Kosmas 1984), dashed brown line: statistical adiabatic channel model (SACM), Eq. (5.2) from Troe (1996).
Current usage metrics show cumulative count of Article Views (full-text article views including HTML views, PDF and ePub downloads, according to the available data) and Abstracts Views on Vision4Press platform.
Data correspond to usage on the plateform after 2015. The current usage metrics is available 48-96 hours after online publication and is updated daily on week days.
Initial download of the metrics may take a while.