Fig. 6
Download original image
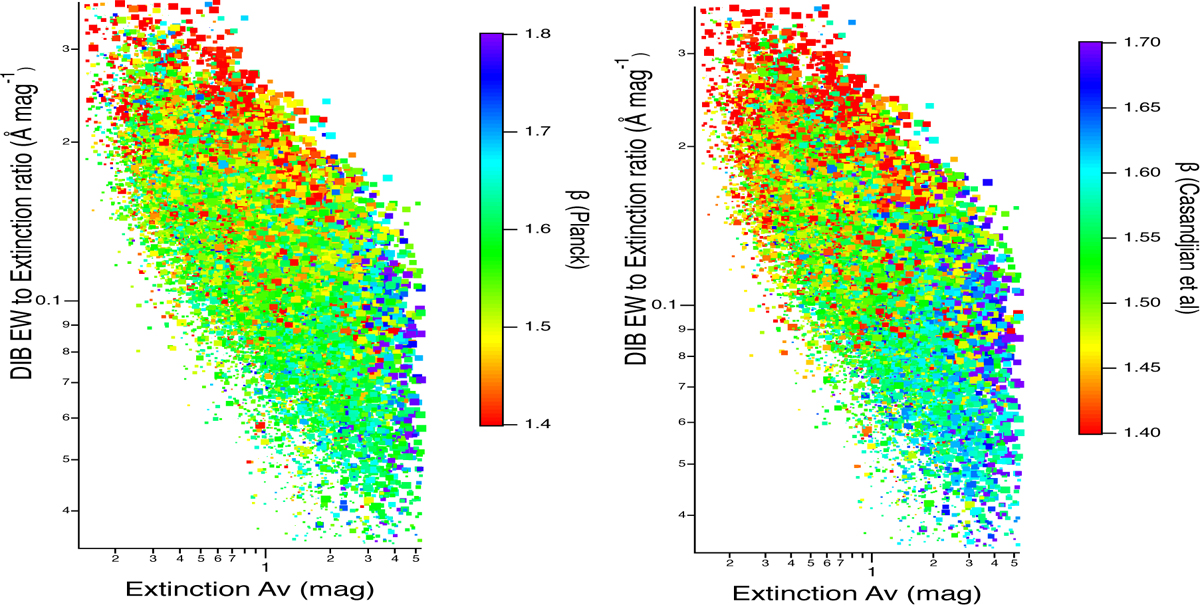
Illustration of the dependence on the extinction regime of the relationship between the normalized DIB and β. Plotted are the normalized ratios as a function of the LOS extinction, color-coded for the β value for each LOS. Marker sizes increase with target location distance to the Plane. The two estimates for β are shown (left and right). Below Av≃3 mag (left part of the graphs), decreasing ![]() (vertical descending lines) corresponds to an increase of β (color from red to green). Above ≃ 3 mag (right part of the graphs), there is an opposite trend: decreasing
(vertical descending lines) corresponds to an increase of β (color from red to green). Above ≃ 3 mag (right part of the graphs), there is an opposite trend: decreasing ![]() (again vertical descending lines) corresponds to a decrease of β (color from violet to green or cyan).
(again vertical descending lines) corresponds to a decrease of β (color from violet to green or cyan).
Current usage metrics show cumulative count of Article Views (full-text article views including HTML views, PDF and ePub downloads, according to the available data) and Abstracts Views on Vision4Press platform.
Data correspond to usage on the plateform after 2015. The current usage metrics is available 48-96 hours after online publication and is updated daily on week days.
Initial download of the metrics may take a while.