Fig. 11
Download original image
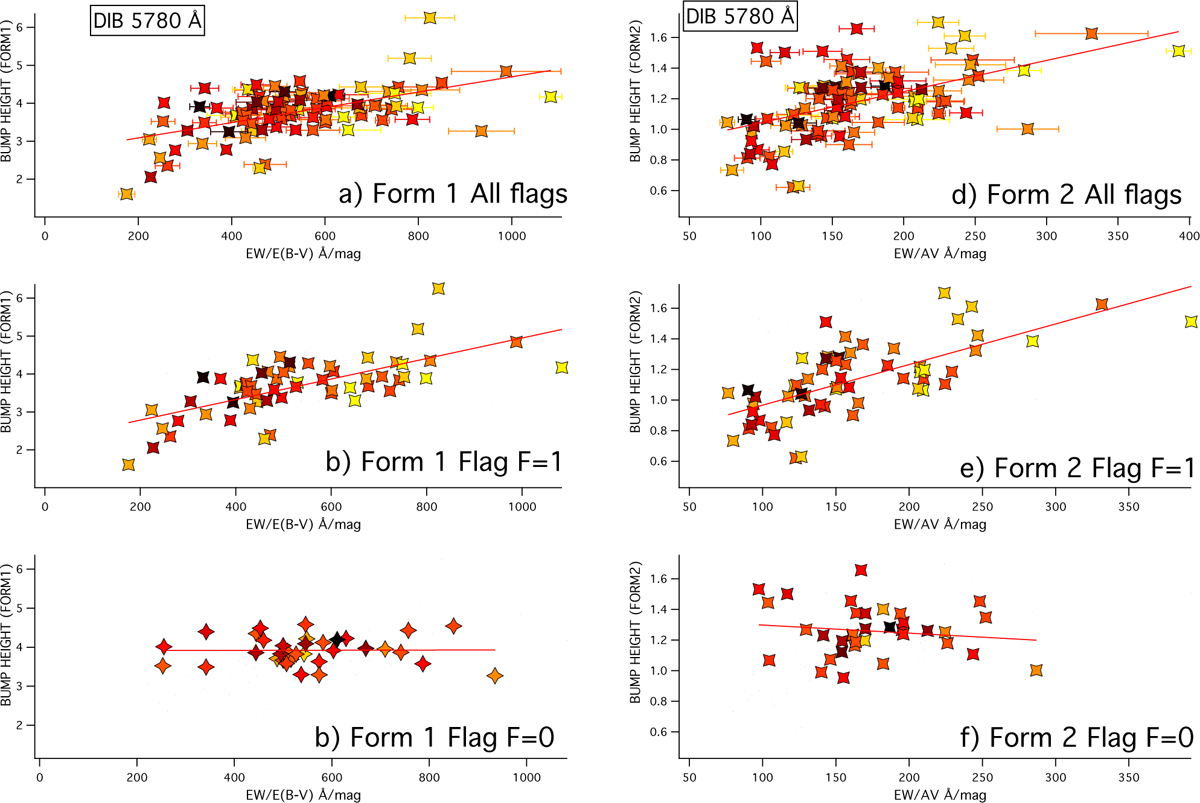
Comparisons between the σ-type 5780 Å DIB EW and the UV bump height, under formalism 1 of the extinction law (a-c) and formalism 2 (d-f). Data are from the compilation of Xiang et al. (2017). (a) and (d) show the bump height vs the reddening-normalized EW for all targets and the adjusted linear fit. The colour-coding refers to the extinction (from yellow for the lowest extinctions to black for the highest ones). Errors bars on EWs are indicated. (b and e) Same as (a) and (d), for flag F=1 stars only. (c and f) Same as (a) and (d) for flag F=0 only. The F=0 LOSs show no dependence, and lower the correlation based on all data. F=1 targets show a clearer positive correlation.
Current usage metrics show cumulative count of Article Views (full-text article views including HTML views, PDF and ePub downloads, according to the available data) and Abstracts Views on Vision4Press platform.
Data correspond to usage on the plateform after 2015. The current usage metrics is available 48-96 hours after online publication and is updated daily on week days.
Initial download of the metrics may take a while.