Fig. 9
Download original image
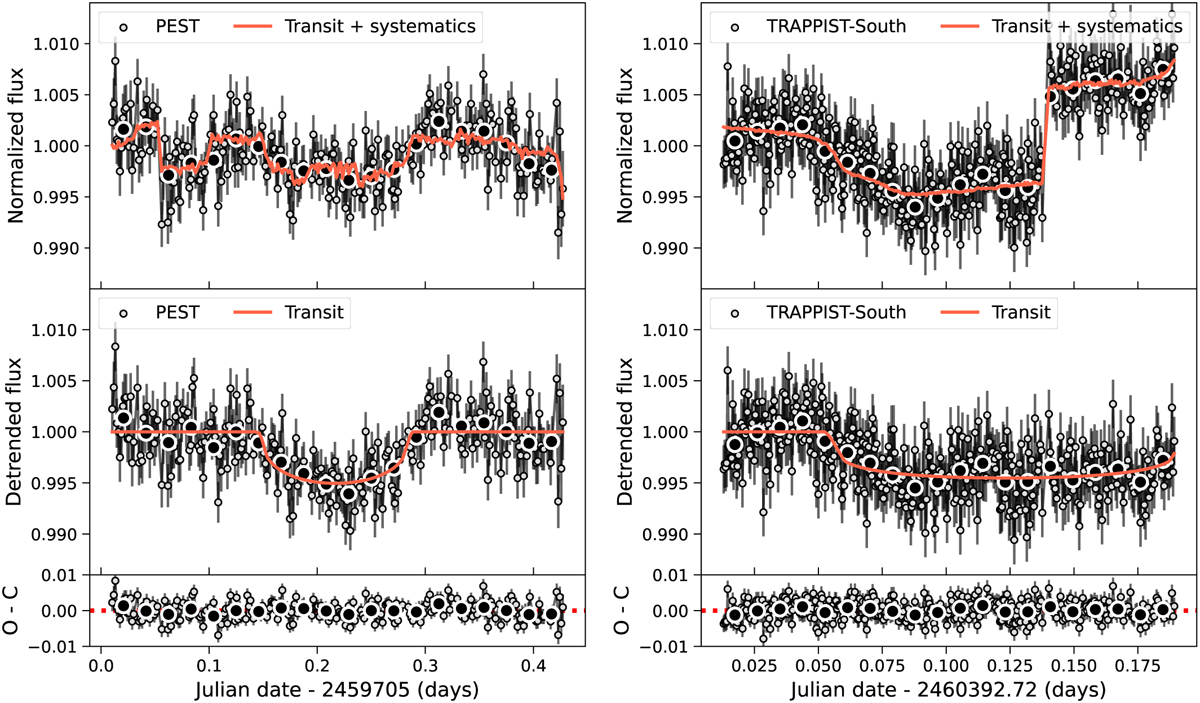
PEST and TRAPPIST-South photometry of TOI-5005 b acquired on 5 May 2022 and 22 March 2024, respectively. The upper panels show the raw photometry extracted from the instrument pipelines (see Sects. 2.2.1 and 2.2.2), the lower panels show the detrended photometry, i.e. the raw photometry subtracted from the systematics model described in Sect. 4.4.2, and the lower panels show the residuals of the joint fit analysis. The red solid lines indicate the median posterior models.
Current usage metrics show cumulative count of Article Views (full-text article views including HTML views, PDF and ePub downloads, according to the available data) and Abstracts Views on Vision4Press platform.
Data correspond to usage on the plateform after 2015. The current usage metrics is available 48-96 hours after online publication and is updated daily on week days.
Initial download of the metrics may take a while.