Fig. 7
Download original image
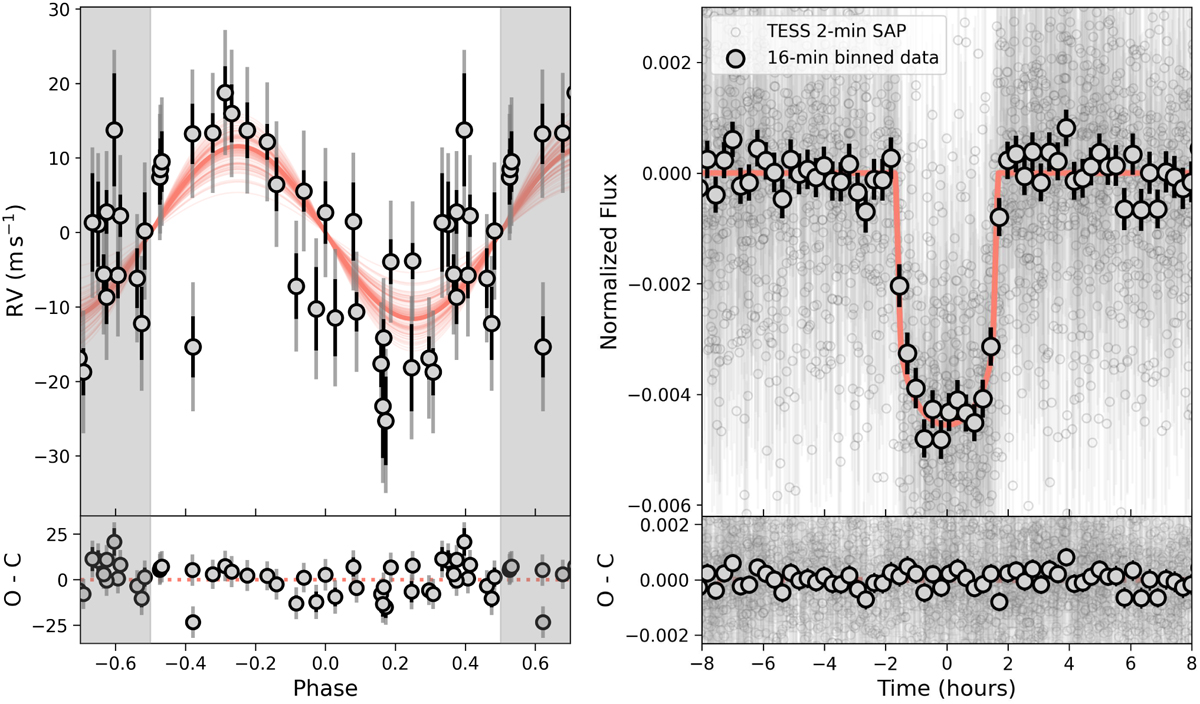
HARPS RVs (left) and TESS photometry (right) subtracted from the linear drift and GP component, and folded to the orbital period of TOI- 5005 b. The black error bars represent the instrument uncertainties and the grey error bars represent the total uncertainties obtained by quadratically adding the corresponding jitter term. The red solid lines indicate the median posterior models. In the HARPS RVs plot we also include 100 random posterior models that illustrate the level of modelling uncertainty.
Current usage metrics show cumulative count of Article Views (full-text article views including HTML views, PDF and ePub downloads, according to the available data) and Abstracts Views on Vision4Press platform.
Data correspond to usage on the plateform after 2015. The current usage metrics is available 48-96 hours after online publication and is updated daily on week days.
Initial download of the metrics may take a while.